SSRS PowerShell Linked report

In this post we create Linked Report using PowerShell script.

Function bellow expect following parameters:

  • $proxy – Reporting Services web proxy, how to get proxy, see this post Connect to Reporting Services with PowerShell
  • $OriginReportPath – Report part of base report
  • $NewPath – path for Linked Report
  • $LinkedName – name for Linked Report
  • $LinkedDescription – Linked Report description

Function uses SSRS Web Service method CreateLinkedReport.

function CreateLinkedReport($proxy,[string] $OriginReportPath, [string]
$NewPath, [string] $LinkedName, [string] $LinkedDescription)
{   
Write-Host "Create linked report: " $NewPath"/" $LinkedName
$prop = New-Object -TypeName SSRS.ReportingService2005.Property
$prop.Name = "Description"
$prop.Value = $LinkedDescription

[SSRS.ReportingService2005.Property[]] $props = @(New-Object SSRS.ReportingService2005.Property)
$props[0] = $prop
try   { 
$Proxy.CreateLinkedReport($LinkedName,$NewPath,$OriginReportPath,$props)
         }
     catch [Exception] 
  {  Write-Host $_.Exception.Message
    }
}

Lets try.

CreateLinkedReport $proxy "/ReportPath/BaseReport" "/NewDir/LinkedReportPath" "LinkedReportName" "LinkedReportDescription"
 

SSRS HTML

SSRS supports functionality when Report Rendering engine interprets HTML tags. It can be useful when you would like to format textbox within Tablix component. Be aware that support of HTML tags is very restricted. Here https://bit.ly/2KA357l you can find list of supported tags.

GOAL

Make format in Sales Report (you can get from one of previous post SSRS Cascading Parameters ), that members of the first group are formatted with first bold letter.

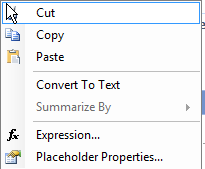
Let’s change Tablix textbox properties supporting Html tags. Click by left mouse to the Tablix Textbox of English Country Region Name, that field definition is highlighted and by right click you can see menu with Placeholder Properties item.

Placeholder Properties
Picture 1 – Placeholder Properties

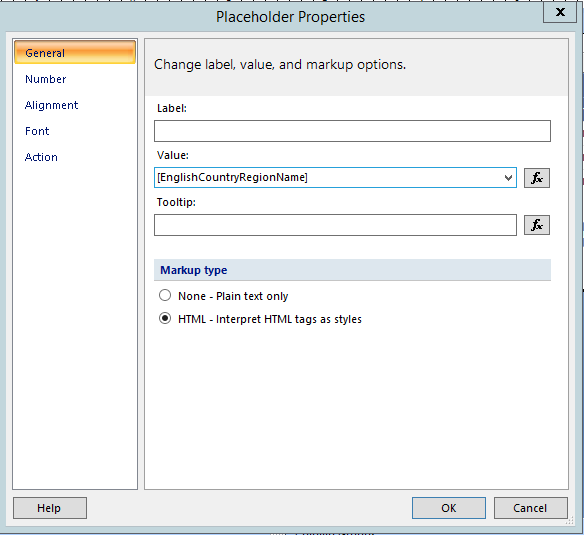
By clicking on the item Placeholder Properties window appears, check Html – Interpret HTML tags as styles at the bottom of the window and confirm. Now we set the Textbox to support HTML tags.

HTML settings
Picture 2 – HTML settings

Let’s make requested format now. Go to Tablix component, English Country Region Group textbox field, open expression box and put formatting formula bellow. Use <b> tag to change letter font to bold. LEFT function ensures that bold format will be applied to first letter only. The rest of the text will be finished using MID and LEN function.

Formatting Expression
Picture 3 – Formatting Expression

LEFT function returns defined number of letters of the string from the left. MID function extract substring from defined string starting with defined position and ending with finishing position. For finishing position, we use LEN function returning number of chars from defined string.

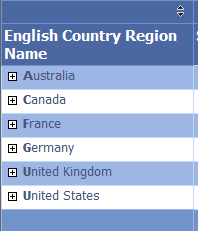
See final format of Sales Report,
English Country Region Name column.

Sales Report Tablix
Picture 4 – Sales Report Tablix

Get data to lab report

I started with series of post, I would like to show how to prepare simple testing environment, you can get the data when you test or compare queries performance for example, and you would like to save results and visualise them.

In this post we create simple table structure and SQL procedure which will be used in next post as Chart dataset.

I would like to save following information’s:

  • Test identification – identification of test – for example testing clustered vs nanocluster index, sorting group vs hash group, etc.
  • Task name – identification of task we made in test – for example task1 = table with clustered index, task2 heap table
  • Counter name (for example number of reads, writes, rows, etc.)
  • Counter value – measured results of tests

As you can see the structure is very simple, I believe we could design much sophisticated solution but for our purposes will be enough. Next time we can extend our solution.

Here is the final structure:

SET
ANSI_NULLS
ON
GO
SET
QUOTED_IDENTIFIER
ON
GO
 
CREATE TABLE [dbo].[LabTable](
    [WorkoutName] [sysname] NOT NULL,
    [TaskOwnerName] [sysname] NOT NULL,
    [CounterName] [sysname] NOT NULL,
    [CounterValue] [sql_variant] NULL,
    [InsertDateTime] [datetime] NULL
)
ON [PRIMARY]
GO
 
ALTER
TABLE [dbo].[LabTable] ADD
CONSTRAINT [df_InsertDateTime] DEFAULT (getdate())
FOR [InsertDateTime]
GO

Stored procedure returning data to dataset:

SET
ANSI_NULLS
ON
GO
SET QUOTED_IDENTIFIER ON
GO
 
CREATE PROCEDURE [dbo].[SSRSGetDatset]
@WorkoutName SYSNAME
AS
BEGIN
SELECT WorkoutName,
     TaskOwnerName,
     CounterName,
     TRY_CONVERT(BIGINT,TRY_CONVERT(DATETIME, CounterValue))
AS CounterValue,
     InsertDateTime
FROM dbo.LabTable
WHERE WorkoutName = @WorkoutName
END
GO

In next post we fill structures with tested data and create graph to visualise our results. Stay tuned.