Incorrect estimation cardinality estimator

Since 2014 version of SQL server, there were implemented new approarches to help query optimizer  better understand your SQL query and data estimation, for example correlation in predicates on the same table, correlation in predicates between tables, that outdated statistics can have newer data, etc…

More info can be found here: https://bit.ly/37ddnoe

Motivation to write this article was that there could be situations the cardinality estimator could make things worse. I am experienced in one of my projects that query stopped to finish in expected time after upgrading SQL server to higher version (from 2008 to 2016). I prepared simple example simulating that situation:

Let’s create table dbo . WrongEstimationTable, which have multiple relationships with another one table dbo.SameTable. I left dbo.WrongEstimationTable
empty, that there will be no rows in result set. So we would expect that execution plan estimates that no rows will be returned.

CREATE TABLE dbo.WrongEstimationTable(id1 BIGINT, id2 BIGINT,id3 BIGINT,id4 BIGINT,id5 BIGINT)

Fill dbo.SameTable with some testing data.

CREATE TABLE dbo.SameTable (id BIGINT,identityid INT IDENTITY(1,1),typeid INT)
INSERT INTO dbo.SameTable(id,typeid) SELECT object_id,1 FROM sys.objects
INSERT INTO dbo.SameTable(id,typeid) SELECT object_id,2 FROM sys.objects

Create indexes to help the query to get the data as fast as possible. 

CREATE CLUSTERED INDEX CX_identityid  ON  dbo.SameTable(identityid )
CREATE UNIQUE  NONCLUSTERED INDEX    CX_id  ON  dbo.SameTable(typeid,id  ) INCLUDE (identityid)

Run the query bellow where dbo.SameTable correlates with dbo.WrongEstimationTable using typeid predicate. Show actual execution plan on older version of SQL server or switch off Cardinality estimator if you use new version of SQL server, query bellow.

SELECT * FROM 
         dbo.WrongEstimationTable t 
JOIN     dbo.SameTable s1 ON s1.id=t.id1 AND s1.typeid=1
JOIN     dbo.SameTable s2 ON s2.id=t.id2 AND s2.typeid=1
JOIN     dbo.SameTable s3 ON s3.id=t.id3 AND s3.typeid=1
JOIN     dbo.SameTable s4 ON s4.id=t.id4 AND s4.typeid=1
JOIN     dbo.SameTable s5 ON s5.id=t.id5 AND s5.typeid=1
OPTION (USE HINT('FORCE_LEGACY_CARDINALITY_ESTIMATION'))

See that optimizer estimates that on the second one table there are no data, so the number of rows and executions are very low – one, as expected.

Execution plan - old optimizer
Picture01 – Execution plan – old optimizer
Execution plan - old optimizer
Picture 02 – Execution plan – old optimizer

Running the same query on SQL server 2016 or earlier builds of SQL Server 2017 leads to very strange execution plan were optimizer expect increasing estimated number of rows in each branch of nested loop to 1024 estimated rows. As you can see on picture bellow. In production it could cause your query to prolong its execution time rapidly.

Execution plan - old optimizer
03 Execution plan – old optimizer
Execution plan - newer optimizer
Picture 04 – Execution plan – newer optimizer

As solution you can:

  1. Rewrite the query
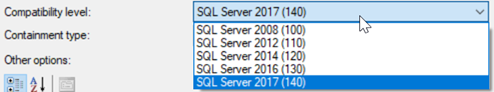
  2. Use the old version of Query Optimizer – it comes with Cumulative update 10 for SQL server 2017 https://bit.ly/2r3YyDO
  3. Use the database compatibility level for 2008 (100)
  4. Switch off Cardinality Estimator use the old functionality of optimizer for Cardinality estimation
  5. Whatever I forgot

1.

SELECT id,identityid INTO #tmp FROM dbo.SameTable WHERE typeid=1
CREATE CLUSTERED INDEX CX_identityid ON #tmp(id) 
CREATE UNIQUE NONCLUSTERED INDEX CX_id ON #tmp( id ) INCLUDE (identityid)
SELECT * 
  FROM dbo.WrongEstimationTable t
  JOIN #tmp s1 ON s1.id=t.id1
  JOIN #tmp s2 ON s2.id=t.id2
  JOIN #tmp s3 ON s3.id=t.id3
  JOIN #tmp s4 ON s4.id=t.id4
  JOIN #tmp s5 ON s5.id=t.id5

2.

SELECT *
FROM dbo.WrongEstimationTable t
JOIN dbo.SameTable s1 ON s1.id=t.id1 AND s1.typeid=1
JOIN dbo.SameTable s2 ON s2.id=t.id2 AND s2.typeid=1
JOIN dbo.SameTable s3 ON s3.id=t.id3 AND s3.typeid=1
JOIN dbo.SameTable s4 ON s4.id=t.id4 AND s4.typeid=1
JOIN dbo.SameTable s5 ON s5.id=t.id5 AND s5.typeid=1
OPTION (USE HINT('QUERY_OPTIMIZER_COMPATIBILITY_LEVEL_100'))

3.

4.

SELECT *
FROM dbo.WrongEstimationTable t
JOIN dbo.SameTable s1 ON s1.id=t.id1 AND s1.typeid=1
JOIN dbo.SameTable s2 ON s2.id=t.id2 AND s2.typeid=1
JOIN dbo.SameTable s3 ON s3.id=t.id3 AND s3.typeid=1
JOIN dbo.SameTable s4 ON s4.id=t.id4 AND s4.typeid=1
JOIN dbo.SameTable s5 ON s5.id=t.id5 AND s5.typeid=1
OPTION (USE HINT('FORCE_LEGACY_CARDINALITY_ESTIMATION'))

I was not able to simulate above described situation on SQL server 2017 with cumulative update 10, https://bit.ly/35egiev, seems the issue was resolved.

When migrating or upgrading your current version of SQL Server to higher version you should check description of new features  or cumulative updates on MSDN. And you should be prepared on scenarios that things could be worse after your updates.

Transaction log – multi-statement table valued function

Someday I got interesting question in my job. Does SELECT query from multi-statement table valued function have impact on transaction log?

Because of result-set, there is a table variable declaration in multi-statement table valued function, we could expect the same behavior as described in post.

It would be interesting to make some tests, because I didn’t think about that simple select from function could affect transaction log of tempdb database. Results were surprising for me, follow reading this post, if you are insterested in. Just to remind, run bellow published scripts on testing environment only. I am using local installation of SQL on my laptop.

I would use similar approach as in post, In short.

  1. Clean up tempdb transaction log, and set the size of the log to the minimum
  2. Create multivalued function and select data from it
  3. Run simple select from the function
  4. In another query window run undocumented function sys.fn_dblog to get data from transaction log
  5. In another query window run allocation unit query extended to locking info (I will explain later)
  6. Check how tempdb transaction log file grew up

Firstly, set tempdb transaction log at the minimum size, to see if there is an impact on the transaction log. And call CHECKPOINT operation to clean-up transaction log. With the query bellow check list of allocation units with allocated pages in tempdb.

select request_type, request_mode,sa.total_pages,so.name, so.object_id, sp.index_id, sp.partition_id, sp.hobt_id, sa.allocation_unit_id, sa.type_desc
, l.*
FROM sys.objects so
JOIN sys.partitions sp on so.object_id = sp.object_id
JOIN sys.allocation_units sa on sa.container_id = sp.hobt_id
LEFT JOIN sys.dm_tran_locks l ON so.object_id =l.resource_associated_entity_id
WHERE total_pages >0

In my environment the query did not return any temporary tables with allocated pages.  So we can start test.

Run script bellow to create testing function.

CREATE FUNCTION [dbo].[fn_GetData]()
RETURNS
@TableTest TABLE (id INT, testdata INT
)
AS
BEGIN
 INSERT INTO @TableTest
SELECT a.object_id
     , a.object_id
FROM sys.objects a
JOIN sys.objects b ON 1=1
JOIN sys.objects c ON 1=1
JOIN sys.objects d ON 1=1
JOIN sys.objects e ON 1=1
RETURN
END
GO

Query to get data from created function.

SELECT * FROM dbo.fn_GetData() ;

In another SQL query window run query returning allocation units, listed above. After querying allocation units from tempdb we can see that there is  temporary table with allocated pages. Run query few times to see that count of allocated pages is increasing. See picture bellow.

Allocation units
Picture 01 Allocation units

Lets check tempdb transaction log file size. We can see that it was increased rapidly.

Transaction log file size
Picture 02 Transaction log file size

It is interesting that even when using simple SELECT from multi-statement table valued function, the tempdb transaction log can be affected. The Table variable declared for result-set inside the function is physically placed in tempdb. It is very similar behavior as in the post.

From sys.fn_dblog function we can see operations on Allocation unit (temporary table) we got from queries above.

Transaction log
Picture03 Transaction log

This time I had problem with DBCC PAGE to check inserted data. I was not able to access data as in post. That was reason why I extended script querying allocation units to locking info, where you can see that temporary table has exclusive lock, so other processes cannot read data from it. In my previous post where I tested impact of  Table variable on transaction log, there was BU (bulk load) lock mode set, so I was able to access data from sys.fn_dblog function.

Conclusion. Not only Table variable could impact transaction log, but multi-statement table valued function can affect it too. It is very interesting, and here raises another reason why you should be careful using these SQL features with respect to query performance. Both object types are physically created in tempdb database, not in memory. I found one difference between the table valued function and Table variable and it is lock escalation on these objects. While in case of Table variable, there was created temporary table in tempdb database with BU request mode, temporary table created by querying the multi-statement function was locked by X (exclusive lock). There would be probably more differrencies but maybe next time, and in another post.


Table variable myths

There are lots of myths regarding Table variable . You can find lots of theories that Table variable has no impact on transaction log since it is out of scope of transaction. You can find   lots of articles that Table variable is stored in memory too. I decided to do some tests to see if Table variable could have impact on transaction log and if it is physically created in tempdb .

Important note at the beginning. Try bellow mentioned queries on your test environment only! Do not run it on production. I used SQL server 2017 installed on my laptop locally. It is better that I could eliminate possible impact of other processes running on SQL Server.

In my sample I created simple Table variable filling with lots of data in while cycle. In another query window I will use undocumented sys.fn_dblog function to read what is happening in transaction log.

I sized transaction log file of temporary table at very low value – 4MB. We will see if insert to Table variable can increase its file size.

Log size
Picture 01 Log size

Let’s clean up transaction log of temporary table first. Look at script where sys.fn_dblog function is called, to see how the transaction log looks like. There are only three records returned.

CHECKPOINT 
SELECT  * FROM sys.fn_dblog(NULL, NULL)
empty tempdb transaction log
Piture 02 empty tempdb transaction log

Execute script with insert rows to Table variable and do it in neverending while cycle, like I do. The main issue was to have query still running while getting data from log. Since the query was stopped, I was not able to get needed data from the log function. So it is important that the query with table variable you would like to analyze will be still running while getting data from transaction log in another query window.

SELECT [Transaction Name], [spid], [Xact ID], f.[Page ID], f.[parent transaction id], [Transaction ID],[Transaction Name] ,AllocUnitName,*
FROM sys.fn_dblog(NULL,NULL) f WHERE [SPID]=56

Get SPID of inserting query and run above mentioned query in new query window with SPID you get.  In output you can see name of Temporary table we created as name of transaction. We are lookingn for Transaction Name wiht AllocPages.

 Get log data based on parent transaction
Picture 04 Get log data based on parent transaction

Take Parent Transaction ID from the row where column Transaction Name = AllocPages and change predicate to select records base on Transaction ID

SELECT [Transaction Name], [spid], [Xact ID], f.[Page ID], f.[parent transaction id], [Transaction ID],[Transaction Name] ,AllocUnitName,* FROM sys.fn_dblog(NULL,NULL) f WHERE [Transaction ID]='0000:00002622'

Here we can see temporary table name in Allocation unit name column. The name of Allocation unit uses the same convention like for local temporary table. It really seems that  Table variable is physically created in tempdb as Temporary table.

Result from log filtered by transaction ID
Picture 05 Result from log filtered by transaction ID

Another view could be made with Allocation units, where you can check how many pages were used in our transaction in Table variable.

SELECT so.name, so.object_id, sp.index_id, sp.partition_id, sp.hobt_id, sa.allocation_unit_id, sa.type_desc, sa.total_pages
FROM sys.objects so
JOIN sys.partitions sp on so.object_id = sp.object_id
JOIN sys.allocation_units sa on sa.container_id = sp.hobt_id
Get data from allocation units and partitions
Picture 06 Get data from allocation units and partitions

Now we verify that the temporary table is connected to our Table variable and if so, that the data are stored in tempdb. We check that data inserting to Table variable can be found in pages of tempdb data files. I took first Page ID from row with Operation of LOP_MODIFY_ROW type.  It is highlighted on picture 05 – 0005:0000bd90. First number 0005 corresponds to tempdb file ID, the second number converted from hex to dec 48528 is page ID.  Use DBCC command  bellow to get SGAM page to get info where pages with data are placed.

DBCC PAGE(2,5, 48528 , 3) WITH TABLERESULTS;

We put 2 as first parameter meaning tempdb database ID. The second  parameter 5 is database file ID, 48528 number of page, and last parameter 3 output style.  Bellow we get list of ranges where pages are allocated.

List allocated pages
Picture 07 List allocated pages

Let’s choose one page from above listed allocated pages range- highlighted. I choose page 48537 using DBCC command again.

DBCC PAGE(2,5, 48537 , 3) WITH TABLERESULTS;

Look at details from DBCC output bellow. At Field column we can find id, testdata column name defined in our Table variable. In VALUES column get data already inserted.

page detail
Picture 08 page detail

We verified that Temporary table dbo.#BC836344 is Table variable we declared in our testing queryNow look at transaction log size. We see that tempdb log file size  increased.

Transaction log size
Picture 09 Transaction log size

When stopped the query inserting data to table variable we can see that the temporary table  disappeared from Transaction log.

Transaction log
Picture 10 Transaction log

Finally we checked that

  • Table variable is actually temporary table created in  tempdb , persisted during query run.
  • we could get inserted data by accessing pages from tempdb
  • DML operation on Table variable have impact on transaction log of tempdb
  • It can even cause unexpected increase of transaction log size

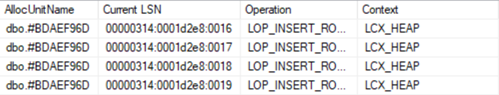
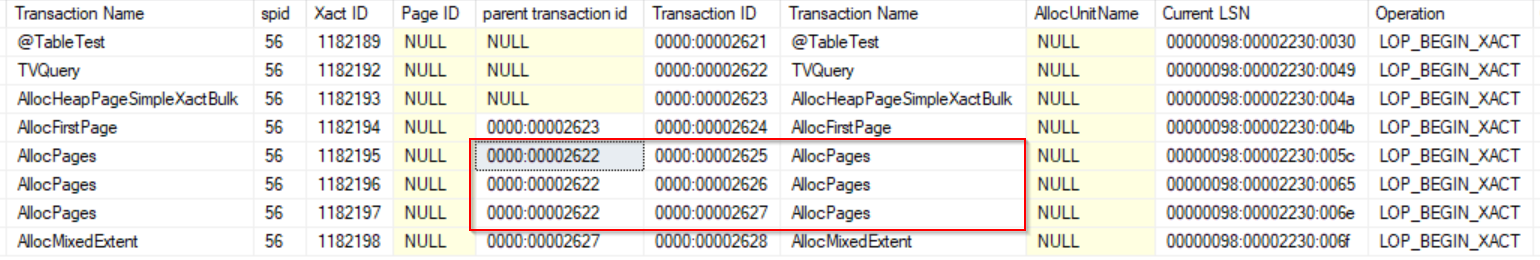
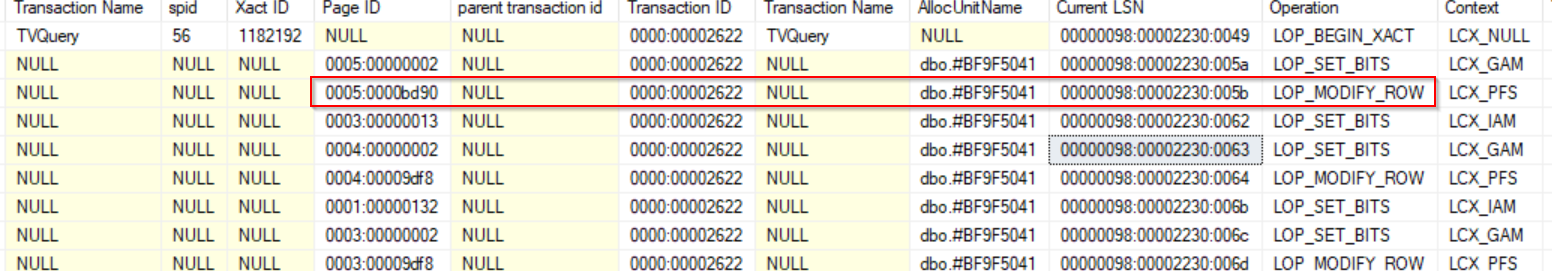
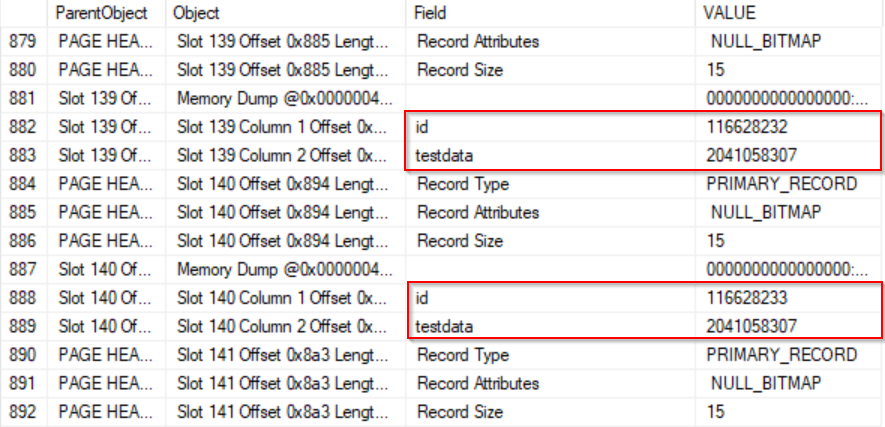
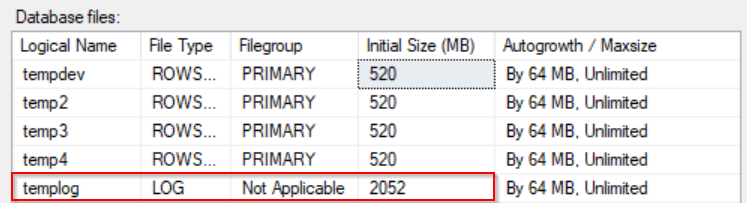
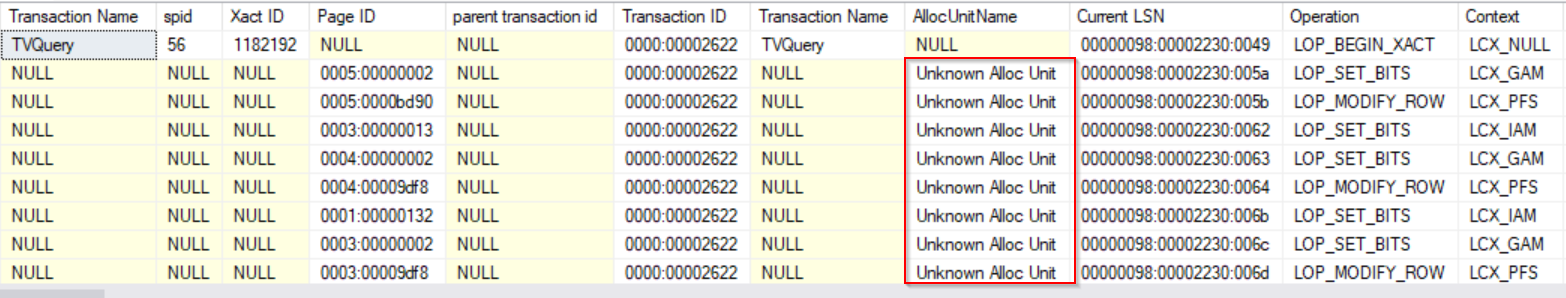
What is not still clear to me, or maybe I dont see it, why it is implemented this way. Table variable is defined like out of transaction scope table by Microsoft. Why there is a need to write data to transaction log, it seems useless to me. 

With this post I proved that Table variable is actually Temporary table, created in tempdb with some specific behavior. Next time could be insteresting to compare above mentioned sample with local Temporary table to see the differences in transaction log and pages allocation. Stay tuned.