In this post we can continue with report we created in post “Report in two minutes”. We would like to extend our matrix definition and add First name column next to the Last name column.
First of all, open Report Builder application and open existing report on Report Server.
Picture 1 Open SSRS report
Go to the directory on report server where report is published and open it.
Picture 2 Choose report on Report Server
The report is in design mode now. Go to the Tablix definition and click on Last Name column that it will be highlighted.
Picture 3 Editing report
Right Click on the column and select Insert column on the popup menu. In next step select Inside Group – Right to put First name column on the right of the Last Name column. You have to notice two basics things. Since we would like to extend LastName group by adding First Name column, we to had click on Last Name column to select the group area. Because we would like to extend this group by adding new column we selected Inside Group option. If we would select Outside Group – Left option, we would add column next to the left Last Name column and outside LastName group region. But in that case First name column would not be grouped and report would not behave as we expect. Look at popup menu, on picture bellow that we are not allowed to be used Outside group – Right option – it is disabled. If we would like to extend the detail group, where measures are placed, and add for example Sum vat column next the Sum Sales, we have to click on Sum Sales column first and then select option for inserting column.
Picture 4 Adding column
Do not forget to publish your report.
Picture 5 Publishing report
It was very short overview how to edit your report using Report Builder. Stay tuned!
In tis “How to” series I would like to explain ways you can edit existing report. Suppose that we have already existing report in Report Server and we would like to change it or extend it. Here is short overview, how you can manage it:
Open report in report builder application and change it
Download report and open report in visual studio with data tools and modify it
Since report is xml document you can download it and use any text editor 🙂
Use Reporting Services web service (C# application, powershell, etc.) to make changes
Reporting Services extensions …
Do you know any other approach, “how to” edit your report?
We need to create a quick overview of the AdventureWorks spreadsheet showing customer revenue for selected period. Our goal is not to describe Report Builder options in detail. This will be described in other separate posts. I would like to create quick “how to” procedure for people who see Reporting services for the first time.
Requirements:
To create a report, you will need a report builder application that you download directly from Reporting Services Report Manager. If you are not able to download it, please contact your administrators to make the application available or set you permissions accessing Report Manager. The application can be downloaded at following link https://bit.ly/2xaRQxB.
Run Report builder application and Report Builder wizard
Defining data sources and connections
Create a dataset and build query
Define report design
Modify generated report
Publication of the report
Detailed procedure:
Go to your reporting services manager url and run Report builder application.
To run the builder report, click on menu link at top menu (picture 1 – bellow).
Picture 1 – Report manager menu
After starting the application, left click on New-> File at the top-left and select Tablix or Matrix Wizard
Picture 2 – Table or Matrix Wizard
Then you have to create new dataset or select an existing one. In our scenario you will create new dataset.
Picture 3 – Dataset dialog
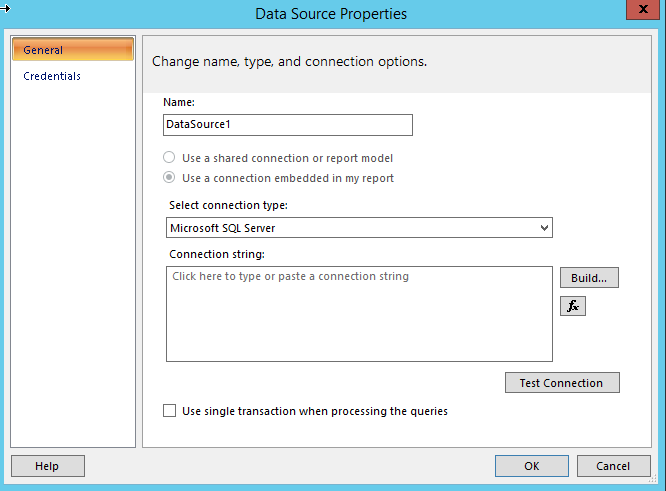
In next window, select connection type and name your data source. You connect to the SQL server – you leave default connection – Microsoft SQL Server.
Picture 4 – datasource
Clicking on Build button next to Connection string new dialog window appears. (or you can type connection string manually to Connection string text area as you can see on picture above).
Picture 5 – Connection properties
Select server you will connect to, then select correspondent database and authentication type that will be used to connect to the server. If you are trying on your local machines suppose you will use Windows Authentication as default.
Picture 6 – Query designer
As next step you have to define dataset for your report. Dataset returns requested data from defined connection. In our scenario we connect to SQL server database so you need to build query to return data form database. Report Builder Wizard offers possibility to create query by query designer – on picture above. You can write your query directly after clicking Edit as Text button, top on the dialog window.
On the left menu there are database objects such views or tables. In the upper right, you define fields for query (picture 6).
Picture 7 – Query designer
In our scenario, select the SalesAmound, Sum_order Quantete field from the FactInternetSales table to be monitored. Use the OrderDateKey column to select a period in the report. To by able to track data by customers, you have to select the columns LastName, MiddleName, Gendeer, AdressLine1. For selected fields in the Aggregate columns, we choose their behaviour. For the fields we want to track Sum_SalesAmount, Sum_OrderQuantity selects Sum operator. For other columns, let Grouped by (Picture 7 – 2;4). According to these columns, the data will be grouped. Select the OrderDateKey column at the bottom of the filters to select the period for which we want to track the data (Picture 7 – 6).. In the field operator, we define behaviour of filters.
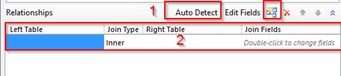
If there is reference integrity defined on the source tables (foreign keys, primary keys), then using Auto Detect (Picture 7 – 5), we create links between the tables in the Relationships section (Picture 8 – 1).
Picture 8 – Query designer – query definition
Click on the Run Query icon at top of the screen to return query data in Query results grid. (Picture 8- 3)
In case that reference integrity is not defined, relationship can be set manually. (Picture 9 ) First click on Auto Detect icon to enable icon on the right. Clicking on that icon creates new relationship (Picture 9 – 2). You have to define tables, join type and join fields to create required relationship.
Picture 9 – Relationships
From the next section Next, we define the report appearance and the layout of the individual elements.
Picture 10 – Report layout
First, select the location of the summation lines in the table. In our case, just leave Show subtotals and grand totals checked.
Click next to select one of the predefined themes. Leave Ocean and click Next.
Picture 11 – Report style
Picture 12 – Report fields definition
In the following window we select requested values and organize them. Our report will have data organized in row group, select the Last Name field in the Row groups and select Sum_SalesAmount, Sum_OrderQuantity in the Values area. The Sum operator was selected by default. By clicking on the arrow of the selected attribute (Picture 11 – 1), it is possible to change the aggregate function.
Clicking Next in report builder wizard displays a preview of the predefined report. At this stage, it is possible to edit the report. We will change the report header in the pre-generated textbox field above the table. (picture 12 – 1)
Picture 13 – Report design
On the left, in the Report Data window, you can check the generated filters after clicking Parameters (Picture 12 – 1). We could view, edit, add Datasets or Data Sources.
Report design
Picture 14
The last step is to publish the report to the report server. Click on the save icon at the top.
Picture 15 – Report builder menu
The next step is a dialog box for selecting a path to save the report and selecting a name.
Picture 16 – Save report dialog
Voila, our first report see the light of day.
Picture 17 – Report
Now we could add more columns to our Tablix, first name for example. It will be explained in next post how to edit existing report.
As you can see you can create your first report very quickly and Report builder wizard helps you to achieve it without detail knowledge of SQL language.