I
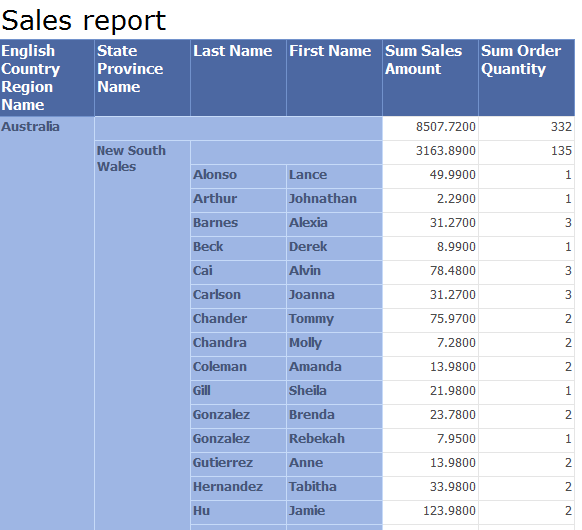
In this post I will explain how to easily set grouping in report Tablix. We will extend our report from post Edit report with Report Builder. If you would like to download the report go to the post page. We will add region name and province name groups to our report, so it will look like on picture bellow.
Short overview
- Extend dataset – add new attributes grouping the data
- Add parent group – English Country Region Name
- Add child group – State province Name
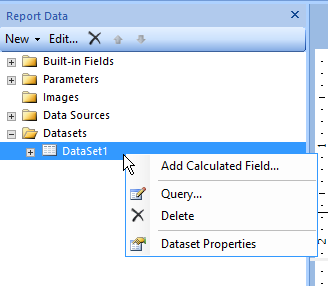
Let’s modify report dataset first. Go to Report data pane, under Datasets item right click on dataset you would like to modify and select Dataset Properties from popup menu.
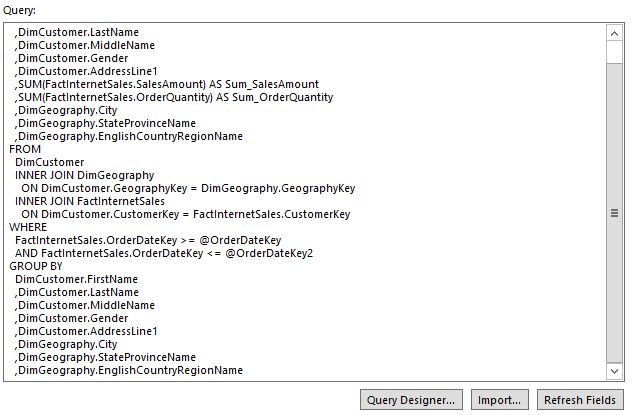
Add attributes from DimGeography dimension. City, StateProvinceName and EnglishCountryRegionName. You can edit query directly in Query text area or using Query Designer.
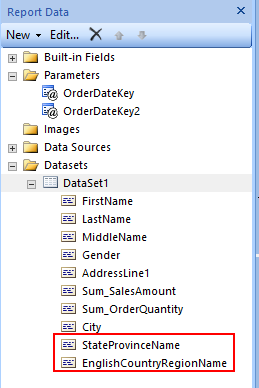
After editing query, by click on Refresh Fields button, we can check new attributes in report dataset.
There are two possibilities how to add new group to the report Tablix.
- Through Grouping Pane
- Directly in Tablix design
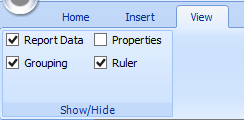
At first, we will add new group through Grouping Pane. Let’s check if we Group Pane is visible in design mode bellow. On the top of the menu click on View and check if Grouping checkbox is checked.
In Grouping Pane -> Row Groups you can see current report Tablix group. We will group our report by EnglishCountryRegoinName
attribute we added by extending our dataset. Right click on LastName group in Row Groups panel and Add Group from popup menu. Because we would like to group our detail data, we select Parent Group option.

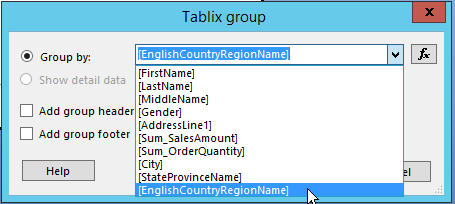
New dialog box appears, we select EnglishCountryRegionName attribute. After Ok button, new column is added on the left side of the Tablix. Grouping direction is from left to->right, which means parent-> child relationship. That’s the reason why new column is added to the left.
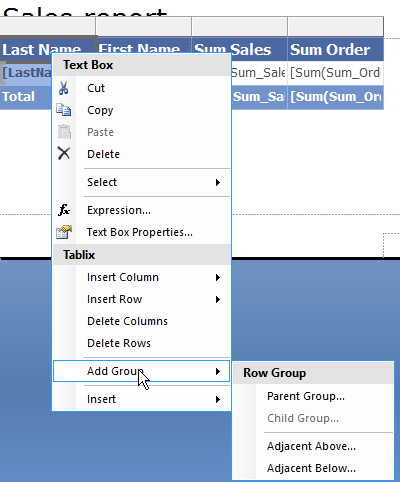
Picture bellow shows the second approach, adding group directly from Tablix area. Right click on textbox in Tablix -> Add Group -> Parent Group from popup menu.
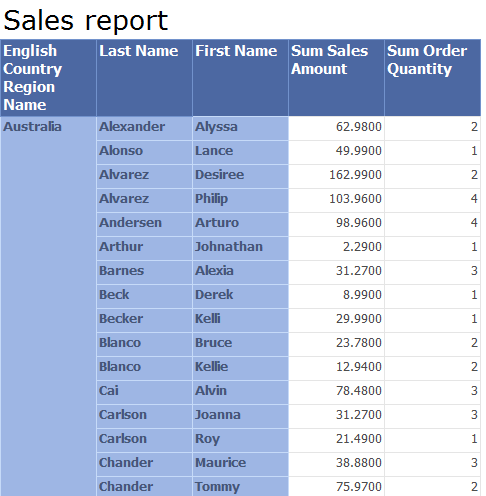
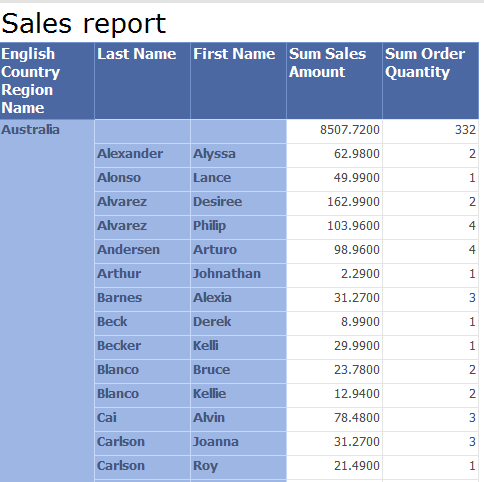
Let’s look at the report now. We can see that data are grouped by region name. But it would be useful to have running totals on the group level, to see how much Sales amount per region was profited.
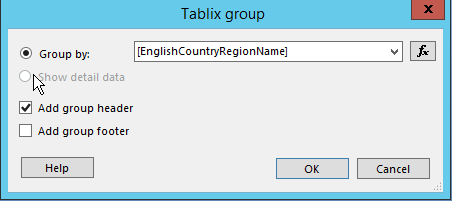
When we return to step when we select grouping attribute, there is a possibility to add group header or group footer. In our case we would like to have totals above detail data, so we check Add group header. In case we would like to have data summarized below grouped data, we choose Add group footer.
Bellow we can see final report matrix design.
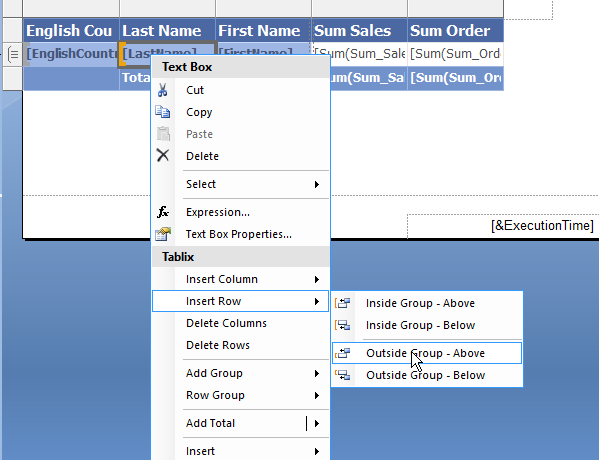
There is another approach how to add Group Totals. We can do it directly from Tablix area. Let’s go back when we have added new group by Group Totals is missing. Right click on Tablix Row -> Insert row from popup menu and select Outside Group – above (if we would like to have totals above grouped data). Before we invoke Popup menu, it is important to choose the inner group area we would like to summarize in Tablix. In our case it is detail group, Lastname group. We achieve it by clicking on Last Name column since it is column inside LastName group. In case we choose Inside Group option we would extend current group and add rows to detail data.
Look on picture bellow how the grouping looks from the design perspective.

Let’s add another group based on StateProvinceName attribute. We would like to place this new group between EnglishCountryRegionName group and Lastname group to create group hierarchy: region name -> province name -> data.
In Grouping Pane -> Row Groups, we can see our new parent group EnglishCountryRegionName. Reporting services set the group name based on attribute name by default. If we would like to change the name, we can manage it trough Group Properties.
Right click on EnglishCountryRegionName -> Add Group -> Child Group, do not forget to focus mouse cursor on parent group. Other option is to select LastName group and add new group as Parent Group.

On picture bellow we see Tablix with new group in design mode.

We would like to have subtotals in this group too, so let’s insert new row outside the group. Follow the same steps like with EnglishCountryRegionName group.
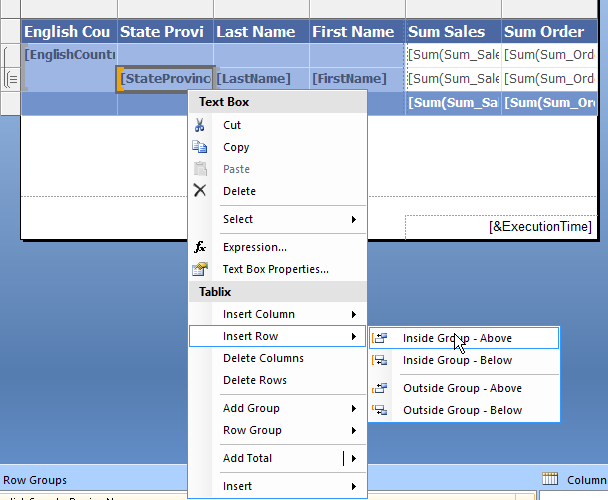
.And that’s it. Picture bellow shows final group hierarchy in group panel.

Picture bellow shows report matrix in design mode.

Here is the final report matrix design with grouping.
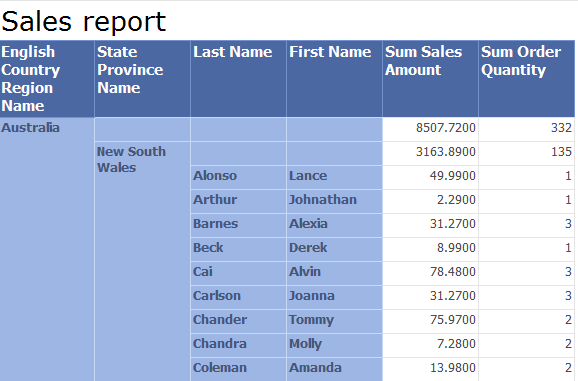
If you follow steps in this post, you should have similar report. You can download it ReportSalesGrouping.
