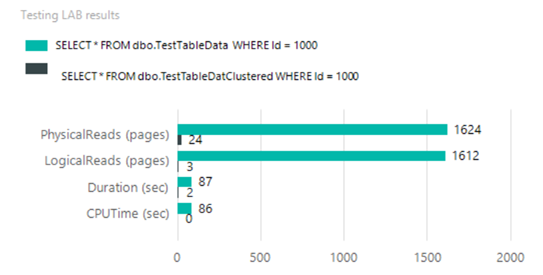
In this post we continue with lab series. I fill prepare structures with tested data. To collect testing results I will use Extended Events, Extended Events utility from this post.
In post we will demonstrate very simple demonstration of clustered index impact on query performance. One table will be created with clustered index and one table stay as heap. After filling tables with data, we start Extended Event Session and run two queries against created tables. When queries finish, we collect the data to lab structure we created in previous post and stop and clean sessions.
Let’s prepare lab structures first.
CREATE TABLE dbo.TestTableData
(id INT )

CREATE TABLE dbo.TestTableDatClustered
(id INT PRIMARY KEY CLUSTERED
)

INSERT INTO dbo.TestTableData
SELECT TOP 1000000 ROW_NUMBER() OVER (ORDER BY (SELECT 1)) rn
FROM sys.objects a
JOIN sys.objects b ON 1=1
JOIN sys.objects c ON 1=1

INSERT INTO dbo.TestTableDatClustered
SELECT TOP 1000000 ROW_NUMBER() OVER (ORDER BY (SELECT 1)) rn
FROM sys.objects a
JOIN sys.objects b ON 1=1
JOIN sys.objects c ON 1=1
Clean cache and get SPID.
SELECT @@SPID
DBCC FREEPROCCACHE
CHECKPOINT
DBCC DROPCLEANBUFFERS
Open new query window and start session with the utility.Extended events monitoring utility
Create and start session.
/*Lets start event session*/ EXEC mnt.MNT_SessionHandler 'CreateSession;StartSession','Test','QueryPlan;IOStat','<Predicate><DatabaseID>5</DatabaseID></Predicate>' /*Lets start events*/
Run test queries.
SELECT * FROM dbo.TestTableData WHERE Id = 1000
SELECT * FROM dbo.TestTableDatClustered WHERE Id = 1000
Get data from Session to temporary table.
EXEC mnt.MNT_SessionHandler 'GetDataFromSession' ,'Test','IOStat;QueryPlan' /*Run query you would like to analyze*/
Let’s clean up the extended event session.
/*Stop session*/ EXEC mnt.MNT_SessionHandler 'EndSession', 'Test' /*clean session*/ EXEC mnt.MNT_SessionHandler 'CleanSession', 'Test' /*Or all in one raw*/ EXEC mnt.MNT_SessionHandler 'CleanSession;EndSession', 'Test' /*Get data to analyze,lets make your own views, predicates... */ SELECT * FROM ##Test
In the script bellow the data from extended events are stored to Lab structures.
INSERT INTO dbo.LabTable
( [CounterValue],[CounterName],[TaskOwnerName], [WorkoutName] )
SELECT CPUTime/ 1000,'CPUTime (sec)', SqlText,'ClusteredIndexTest'
FROM dbo.##Test WHERE SqlText = ' SELECT * FROM dbo.TestTableData WHERE Id = 1000'
AND [Type] = 'QueryPlan'
INSERT INTO dbo.LabTable
( [CounterValue],[CounterName],[TaskOwnerName], [WorkoutName] )
SELECT Duration/ 1000,'Duration (sec)', SqlText,'ClusteredIndexTest'
FROM dbo.##Test WHERE SqlText = ' SELECT * FROM dbo.TestTableData WHERE Id = 1000'
AND [Type] = 'QueryPlan'
INSERT INTO dbo.LabTable
( [CounterValue],[CounterName],[TaskOwnerName], [WorkoutName] )
SELECT PhysicalReads,'PhysicalReads (pages)', SqlText,'ClusteredIndexTest'
FROM dbo.##Test WHERE SqlText = ' SELECT * FROM dbo.TestTableData WHERE Id = 1000' AND [Type] = 'IOSql'
INSERT INTO dbo.LabTable
( [CounterValue],[CounterName],[TaskOwnerName], [WorkoutName] )
SELECT LogicalReads,'LogicalReads (pages)', SqlText,'ClusteredIndexTest'
FROM dbo.##Test WHERE SqlText = ' SELECT * FROM dbo.TestTableData WHERE Id = 1000' AND [Type] = 'IOSql'

INSERT INTO dbo.LabTable( [CounterValue],[CounterName],[TaskOwnerName], [WorkoutName] )
SELECT CPUTime/ 1000,'CPUTime (sec)', SqlText,'ClusteredIndexTest'
FROM dbo.##Test WHERE SqlText LIKE '%dbo.TestTableDatClustered%' AND [Type] = 'QueryPlan'
INSERT INTO dbo.LabTable ( [CounterValue],[CounterName],[TaskOwnerName], [WorkoutName] )
SELECT Duration/ 1000,'Duration (sec)', SqlText,'ClusteredIndexTest'
FROM dbo.##Test WHERE SqlText LIKE '%dbo.TestTableDatClustered%' AND [Type] = 'QueryPlan'

INSERT INTO dbo.LabTable ( [CounterValue],[CounterName],[TaskOwnerName], [WorkoutName] )
SELECT PhysicalReads,'PhysicalReads (pages)', SqlText,'ClusteredIndexTest'
FROM dbo.##Test WHERE SqlText LIKE '%dbo.TestTableDatClustered%' AND [Type] = 'IOSql'

INSERT INTO dbo.LabTable ( [CounterValue],[CounterName],[TaskOwnerName], [WorkoutName] )
SELECT LogicalReads,'LogicalReads (pages)', SqlText,'ClusteredIndexTest'
FROM dbo.##Test WHERE SqlText LIKE '%dbo.TestTableDatClustered%' AND [Type] = 'IOSql'
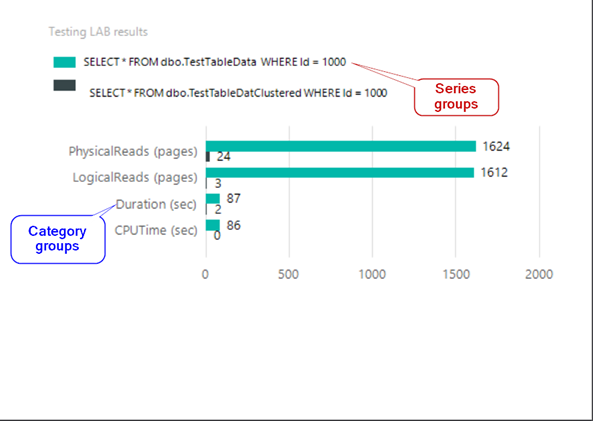
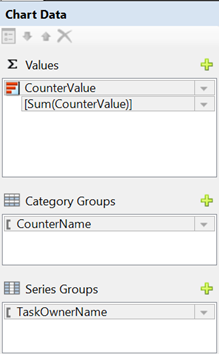
In next post we visualise the data in SSRS chart, so stay tuned.

