Monitoring Deadlocks With Extended Events

With Extended events you can monitor and analyse occurence of deadlocks. Like traces there is a possibility to get information about deadlock occured in system. Lets have a look on it in detail in this post.

Lets create event session to monitor our deadlock.

CREATE EVENT SESSION DeadLockSession ON SERVER 
    ADD EVENT sqlserver.xml_deadlock_report  -- ,
      (
      ACTION (sqlserver.sql_text, sqlserver.tsql_stack, sqlserver.database_id,sqlserver.username)
       /*Filter error no or db number*/
     )   
    ADD TARGET package0.ring_buffer    
        (SET max_memory = 4096 
    ) 
WITH (max_dispatch_latency = 30 seconds)

Starting esssion:

ALTER EVENT SESSION  DeadLockSession ON SERVER
STATE = START

Now I create structures, two tables,  and fill them with data. I will use it to raise a deadlock.

CREATE TABLE dbo.ConcurentTest (id INT IDENTITY(1,1))
ALTER TABLE dbo.ConcurentTest ADD col INT
CREATE TABLE dbo.ConcurentTest2 (id INT IDENTITY(1,1))
ALTER TABLE dbo.ConcurentTest2 ADD col INT
INSERT INTO dbo.ConcurentTest(col) SELECT 1 FROM sys.objects
INSERT INTO dbo.ConcurentTest2 (col) SELECT 1 FROM sys.objects

To create deadlock open two query windows in management studio and run queries (updates on tables) in bellow mentioned scripts in order specified in table bellow. We cause that queries will block each other to complete its operation because of U and X locks on our objects.

Query1

BEGIN TRAN
UPDATE dbo.ConcurentTest SET col=4 
WhERE id = 5
UPDATE dbo.ConcurentTest2 SET col=4 
WhERE id = 8
COMMIT

Query2

BEGIN TRAN
UPDATE dbo.ConcurentTest2 SET col=4 
WhERE id = 6
UPDATE dbo.ConcurentTest SET col=10
WhERE id = 7
COMMIT

Order to run queries.

OrderScript1Script2
1BEGIN TRAN
UPDATE dbo.ConcurentTest SET col=4
WhERE id = 5
2BEGIN TRAN
UPDATE dbo.ConcurentTest2 SET col=4
WhERE id = 6
3
UPDATE dbo.ConcurentTest2 SET col=4
WhERE id = 8
4
UPDATE dbo.ConcurentTest SET col=10
WhERE id = 7

Now , in one of your query window you should see deadlock message. Query in this window was marked as deadlock victim and will not finish. Updates in the other query windows will be executed and data will be updated.

Now take a look on output from extended event xml_deadlock_report.

Put data to temporary table

IF OBJECT_ID('tempdb.dbo.#LogData') IS NOT NULL
 DROP TABLE #LogData;
SELECT
       CAST(LocksAcquired.TargetXml AS XML)  AS XMLData
   INTO
       #LogData
   FROM
       (
       SELECT
               CAST(t.target_data AS XML)  AS TargetXml 
           FROM
                    sys.dm_xe_session_targets  AS t
               JOIN sys.dm_xe_sessions         AS s
                   ON s.address = t.event_session_address
           WHERE
            
               s.name        = 'DeadLockSession'
       )
     LocksAcquired

Lets parse data.

SELECT p.XMLData.value('(inputbuf)[1]', 'varchar(1000)' ) AS [SqlText] ,
   p.XMLData.value('(@lockMode)[1]', 'varchar(1000)' ) AS [LockMode],
   p.XMLData.value('(@isolationlevel)[1]', 'varchar(1000)' ) AS [IsolationLevel],
   p.XMLData.value('(@spid)[1]', 'varchar(1000)' ) AS [SPID],
   p.XMLData.value('(@id)[1]', 'varchar(1000)' ) AS [processID]
  FROM #LogData tt
CROSS APPLY XMLData.nodes('/RingBufferTarget/event[@name="xml_deadlock_report"]') AS T(XMLData) 
CROSS APPLY T.XMLData.nodes('data/value/deadlock/process-list') AS i(XMLData) 
CROSS APPLY i.XMLData.nodes('process') AS p(XMLData) 

 SELECT	 p.XMLData.value('(@objectname)[1]', 'varchar(1000)' ) AS [OwnerObjectName] 
   ,p.XMLData.value('(owner-list/owner/@id)[1]', 'varchar(1000)' ) AS [OwnerProcessId] 
   ,p.XMLData.value('(waiter-list/waiter/@id)[1]', 'varchar(1000)' ) AS [WaiterProcessId] 
  FROM #LogData tt
CROSS APPLY XMLData.nodes('/RingBufferTarget/event[@name="xml_deadlock_report"]') AS T(XMLData) 
CROSS APPLY T.XMLData.nodes('data/value/deadlock/resource-list') AS i(XMLData) 
CROSS APPLY i.XMLData.nodes('ridlock') AS p(XMLData) 

 SELECT  i.XMLData.value('(victimProcess/@id)[1]', 'varchar(1000)' ) AS [VictimProcessId] 
 FROM #LogData tt
CROSS APPLY XMLData.nodes('/RingBufferTarget/event[@name="xml_deadlock_report"]') AS T(XMLData) 
CROSS APPLY T.XMLData.nodes('data/value/deadlock/victim-list') AS i(XMLData)

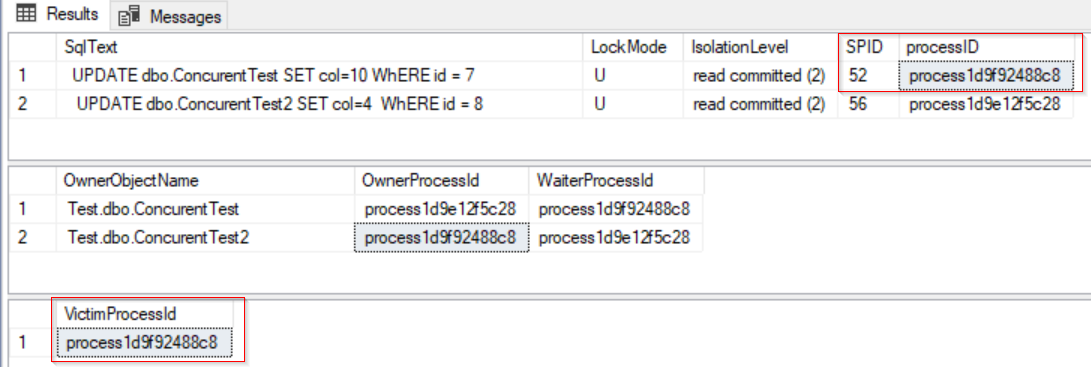
After running scipts above you should see which process was evaluated as deadlock victim, marked on picture bellow. You can get queries causing deadlocks with their SPIDSs. There are more interesting informations like deadlock type. In our case it was RID lock since we dont have any index on our structures and page the query touches.

As you can see extended events are very handful in deadlocks scenarios. Since I am still addicting to extended events deeper and deeper you can look forward to another posts with this topic.

Extended events – max dispatch latency


MAX_DISPATCH_LATENCY as extended event session property – Specifies the amount of time that events are buffered in memory before being dispatched to event session targets. States in MSDN see link https://bit.ly/33He9Zt. The default for this value for this option is 30 seconds, and when you set it to 0 buffers are flushed to targets when they are full, or session is closed.

Let’s make a test, how we can check this behaviour. Here you can check in buffer_processed_count attribute how many times were buffer flushed to target. Let’s go to prove this behaviour.

Summary:

  • Let’s start extended events session and configure it for with max_dispatch_latency 1 seconds, I will use Ring Buffer as the target
  • There will be running script for 30 seconds and each second there will be raised user message to the system
  • With above mentioned configuration we will find 30 in buffer_processed_count because buffer is flushed each 1 second so it will be called 30 times
  • Clear session, create it again with changed configuration for max_dispatch_latency 30 seconds
  • Now you should see 1 in buffer_processed_count buffer is flushed each 30 seconds, our script runs for 30 seconds, there it comes with 1
  • Buffer is flushed to target when user calls

Query to get buffer_processed_count bellow 

SELECT s.buffer_processed_count,s.name,s.total_regular_buffers,s.regular_buffer_size,s.total_large_buffers,s.large_buffer_size,s.dropped_event_count,s.dropped_buffer_count,ss.largest_event_dropped_size
FROM sys.dm_xe_sessions
AS s;

Script bellow lasts 30 seconds and each second there is raised user message.

 DECLARE @Message VARCHAR(100)  
DECLARE @i INT = 0
DECLARE @sql VARCHAR(30)=''
WHILE @i <30
BEGIn
    SET @sql= 'SELECT ' + CAST (@i AS VARCHAR(20))
    SET @Message='Hello '+ CAST (@i AS VARCHAR(20) )+' '+CONVERT(VARCHAR(20),GETDATE(),120)
    RAISERROR( @Message,1,1);
    EXEC (@sql)
    WAITFOR DELAY '00:00:01'
   SET @i=@i+1
END

Let’s start session. 

CREATE EVENT SESSION TestSession ON SERVER ADD EVENT sqlserver.error_reported
(
ACTION (sqlserver.sql_text, sqlserver.tsql_stack, sqlserver.database_id,sqlserver.username)
WHERE sqlserver.database_id = 21 AND [error_number]=50000
)
ADD TARGET package0.ring_buffer (SET max_memory = 4096 ) WITH (max_dispatch_latency =1 seconds)
ALTER EVENT SESSION TestSession ON SERVER STATE = START

Here you can see that target was accessed 30 times.

Buffer processed count

Clean the session 

IF EXISTS (SELECT NULL FROM sys.server_event_sessions WHERE name = 'TestSession')
BEGIN
DROP EVENT SESSION TestSession ON SERVER;
END

Run it again with changed attribute max_dispatch_latency =30 seconds. Bellow you can see that target was accessed only 1 time.

Buffer processed count

Beware of that the counter changes in cases you access targets manually with script bellow.

IF OBJECT_ID('tempdb.dbo.#LogData') IS NOT NULL
DROP TABLE #LogData;
SELECT CAST(LocksAcquired.TargetXml AS XML) AS XMLData
INTO #LogData 
FROM (SELECT CAST(t.target_data AS XML) AS TargetXml 
FROM sys.dm_xe_session_targets AS t
JOIN sys.dm_xe_sessions AS s ON s.address = t.event_session_address
WHERE s.name='TestSession'
) AS LocksAcquired;
SELECT T.XMLData.value('(action[@name="sql_text"])[1]', 'varchar(1000)' ) AS [SqlText],
       T.XMLData.value('(@timestamp)[1]', 'datetime' )AS [OccurredDtTm],
       T.XMLData.value('(data[@name="message"])[1]','varchar(60)' ) AS [Message]
FROM #LogData CROSS APPLY XMLData.nodes('/RingBufferTarget/event[@name="error_reported"]') AS T(XMLData);

Get data to lab report

In this post we continue with lab series. I fill prepare structures with tested data. To collect testing results I will use Extended Events, Extended Events utility from this post.

In post we will demonstrate very simple demonstration of clustered index impact on query performance. One table will be created with clustered index and one table stay as heap. After filling tables with data, we start Extended Event Session and run two queries against created tables. When queries finish, we collect the data to lab structure we created in previous post and stop and clean sessions.

Let’s prepare lab structures first.

CREATE TABLE dbo.TestTableData
(id INT )
 
CREATE TABLE dbo.TestTableDatClustered
(id INT PRIMARY KEY CLUSTERED
)
 
INSERT INTO dbo.TestTableData
SELECT TOP 1000000 ROW_NUMBER() OVER (ORDER BY (SELECT 1)) rn 
FROM sys.objects a
JOIN sys.objects b ON 1=1
JOIN sys.objects c ON 1=1
 
INSERT INTO dbo.TestTableDatClustered
SELECT TOP 1000000 ROW_NUMBER() OVER (ORDER BY (SELECT 1)) rn 
FROM sys.objects a
JOIN sys.objects b ON 1=1
JOIN sys.objects c ON 1=1

Clean cache and get SPID.

SELECT @@SPID
DBCC FREEPROCCACHE
CHECKPOINT
DBCC DROPCLEANBUFFERS

Open new query window and start session with the utility.Extended events monitoring utility

Create and start session.

/*Lets start event session*/ EXEC mnt.MNT_SessionHandler 'CreateSession;StartSession','Test','QueryPlan;IOStat','<Predicate><DatabaseID>5</DatabaseID></Predicate>' /*Lets start events*/

Run test queries.

SELECT * FROM dbo.TestTableData WHERE Id = 1000
SELECT * FROM dbo.TestTableDatClustered WHERE Id = 1000

Get data from Session to temporary table.

EXEC mnt.MNT_SessionHandler 'GetDataFromSession' ,'Test','IOStat;QueryPlan' /*Run query you would like to analyze*/  

Let’s clean up the extended event session.

/*Stop session*/ EXEC mnt.MNT_SessionHandler 'EndSession', 'Test' /*clean session*/ EXEC mnt.MNT_SessionHandler 'CleanSession', 'Test' /*Or all in one raw*/ EXEC mnt.MNT_SessionHandler 'CleanSession;EndSession', 'Test' /*Get data to analyze,lets make your own views, predicates... */ SELECT * FROM ##Test

In the script bellow the data from extended events are stored to Lab structures.

 
INSERT INTO dbo.LabTable
( [CounterValue],[CounterName],[TaskOwnerName], [WorkoutName] )
SELECT CPUTime/ 1000,'CPUTime (sec)', SqlText,'ClusteredIndexTest'
FROM dbo.##Test WHERE SqlText = ' SELECT * FROM dbo.TestTableData WHERE Id = 1000'
AND [Type] = 'QueryPlan'
INSERT INTO dbo.LabTable
( [CounterValue],[CounterName],[TaskOwnerName], [WorkoutName] )
SELECT Duration/ 1000,'Duration (sec)', SqlText,'ClusteredIndexTest'
FROM dbo.##Test WHERE SqlText = ' SELECT * FROM dbo.TestTableData WHERE Id = 1000'
AND [Type] = 'QueryPlan'
INSERT INTO dbo.LabTable
( [CounterValue],[CounterName],[TaskOwnerName], [WorkoutName] )
SELECT PhysicalReads,'PhysicalReads (pages)', SqlText,'ClusteredIndexTest'
FROM dbo.##Test WHERE SqlText = ' SELECT * FROM dbo.TestTableData WHERE Id = 1000' AND [Type] = 'IOSql'
INSERT INTO dbo.LabTable
( [CounterValue],[CounterName],[TaskOwnerName], [WorkoutName] )
SELECT LogicalReads,'LogicalReads (pages)', SqlText,'ClusteredIndexTest'
FROM dbo.##Test WHERE SqlText = ' SELECT * FROM dbo.TestTableData WHERE Id = 1000' AND [Type] = 'IOSql'
 
INSERT INTO dbo.LabTable( [CounterValue],[CounterName],[TaskOwnerName], [WorkoutName] )
SELECT CPUTime/ 1000,'CPUTime (sec)', SqlText,'ClusteredIndexTest'
FROM dbo.##Test WHERE SqlText LIKE '%dbo.TestTableDatClustered%' AND [Type] = 'QueryPlan'
INSERT INTO dbo.LabTable ( [CounterValue],[CounterName],[TaskOwnerName], [WorkoutName] )
SELECT Duration/ 1000,'Duration (sec)', SqlText,'ClusteredIndexTest'
FROM dbo.##Test WHERE SqlText LIKE '%dbo.TestTableDatClustered%' AND [Type] = 'QueryPlan'

INSERT INTO dbo.LabTable ( [CounterValue],[CounterName],[TaskOwnerName], [WorkoutName] )
SELECT PhysicalReads,'PhysicalReads (pages)', SqlText,'ClusteredIndexTest'
FROM dbo.##Test WHERE SqlText LIKE '%dbo.TestTableDatClustered%' AND [Type] = 'IOSql'

INSERT INTO dbo.LabTable ( [CounterValue],[CounterName],[TaskOwnerName], [WorkoutName] )
SELECT LogicalReads,'LogicalReads (pages)', SqlText,'ClusteredIndexTest'
FROM dbo.##Test WHERE SqlText LIKE '%dbo.TestTableDatClustered%' AND [Type] = 'IOSql'

In next post we visualise the data in SSRS chart, so stay tuned.