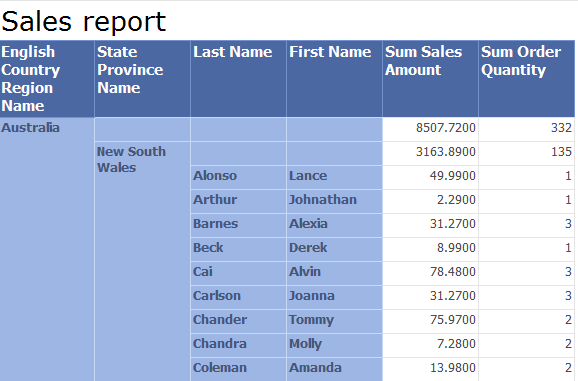
Parametrized group Expand/Collapse Tablix Report

In one of previous post I wrote about expand, collapse groups and how useful feature for Tablix component it is. User can expand data of each individual group member to its detail. But in case user would like to expand all group members, the solution becomes inconvenient for fast work with reporting. User must go and click on each member of group to expand data. In case that child groups are set to have the same toggle functionality, collapsed by default, it could become a nightmare for user to work with such a report. Fortunately, you can use parameters to handle Expand/Collapse state of groups. In this post I will show you approach I use in my projects.

Steps in short:

  1. Define report parameter with member correspondent to groups in Tablix
  2. Define report variables connected to the parameter and returning true or false for visibility of each groups
  3. Set group visibility property based on expression
  4. Set toggle item default state based on expression

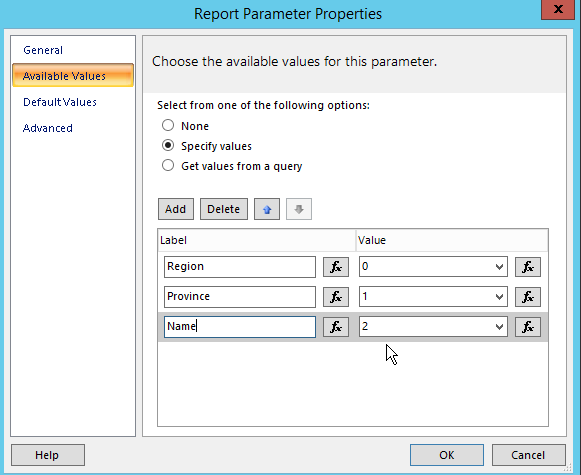
Create report parameter first. Let’s name it Level, as group level user would like to expand. Go to Parameters Pane, right click above Parameters item and click Add new parameter. In Report Parameter Properties dialog set name and Integer as Parameter Type in general tab. Then go to Available Values tab and set Specify values checkbox – type values user can select. I set values that mean group levels – for our report: Region, Province, Name with values from 0 to 2. The Integer values mean level of group hierarchy. You will see their usage later in this post.
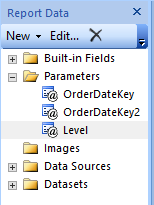
Report data, Parameters
Picture 1 – Report data, Parameters
Report Parameter Properties
Picture 2 Report Parameter Properties

As default values type 0 to choose Region group level by default. It means that our report will be Collapsed by default.
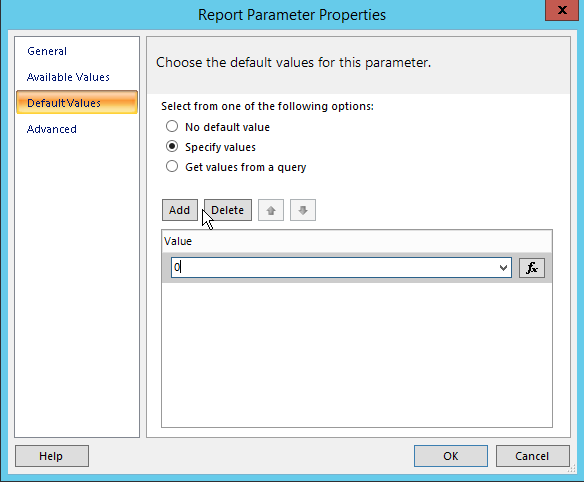
Report Parameters, Specify values
Picture 3 – Report Parameters, Specify values

Right click in Report Builder design surface near to the Tablix component and select Report Properties from popup. Then go to Variables tab and Add 3 variables corresponding to parameter values I set in previous step: Region, Province, Name. I would prefer to use variables that it can be easily manageable on one place, but solution could be implemented directly through expressions. Furthermore, solution with variables could help performance of the report rendering too (see in next posts). To Value items set to them expression which returns true or false value, based on level returned from selected parameter Level. This means when user selects parameter value, these variables calculate visibility for correspondent group.
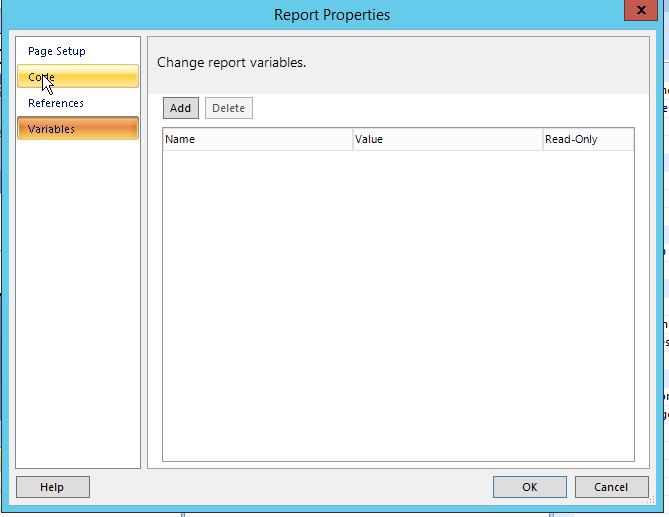
Report Properties Variables
Picture 4 – Report Properties Variables

Here are expressions you put to variable values:

Region

=IIF(Parameters!Level.Value<=0,true,false)

Province

=IIF(Parameters!Level.Value<=1,true,false)

Name

=IIF(Parameters!Level.Value<=2,true,false)

On picture bellow there are defined each variables.
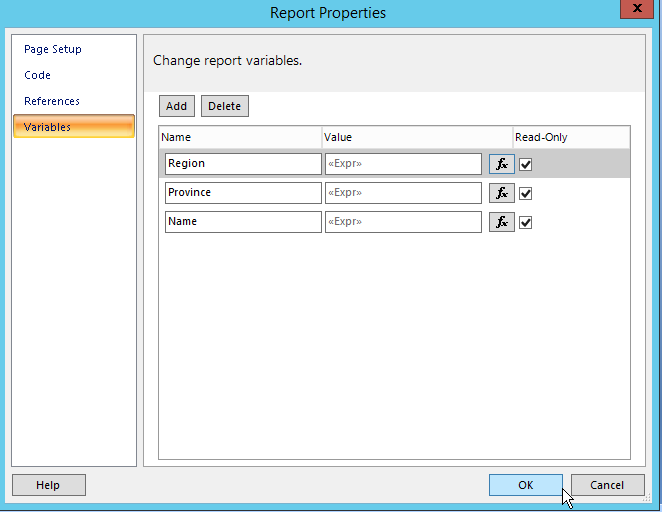
Report Properties, Variables
Picture 5 – Report Properties, Variables

To define expression for each variable, click on expression icon on the right side of input box for Variable and define expression.
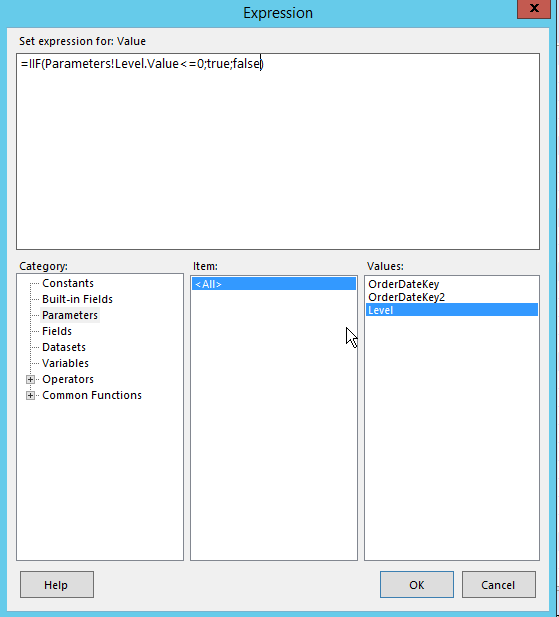
Report Properies, Variables, Expression
Picture 6 – Report Properies, Variables, Expression

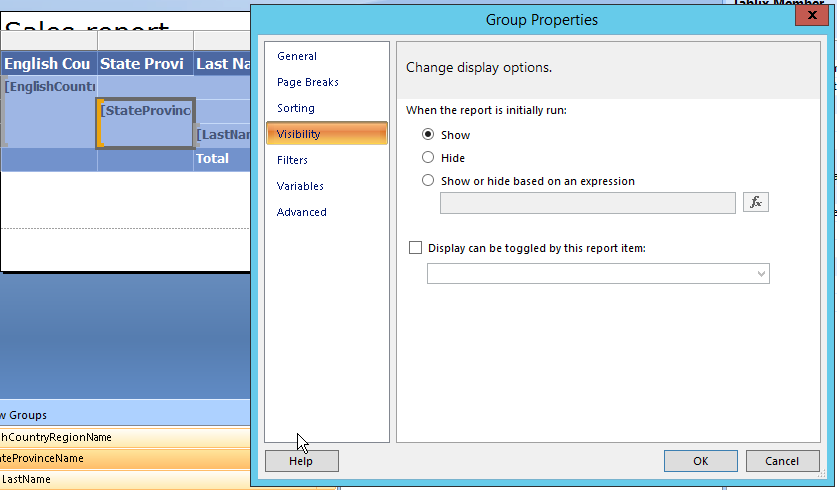
Now we set visibility for each group. Because EnglishCountryRegionName name group is default group, it will be visible when user runs report by default. We set Visibility setting for this group to Show. Go to the next group, StateProvinceName group, click to its group area, and set Region variable value to the group visibility property. You can get it by two ways:

Right click on the group StateProvinceName name in the Grouping pane, Visibility section and Show or hide based on expression.

Or you can do it directly in the Properties Pane. When you click on the group in Grouping pane, Hidden property on Properties Pane and set expression value Variables!Region.Value.
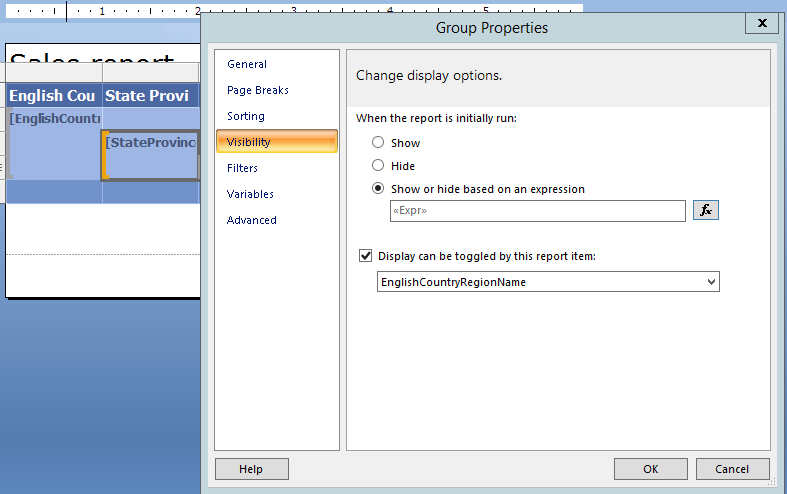
Group Properties, Visibility
Picture 7 – Group Properties, Visibility

I set Region variable value to Show or hide based on expression of StateProvinceName group.
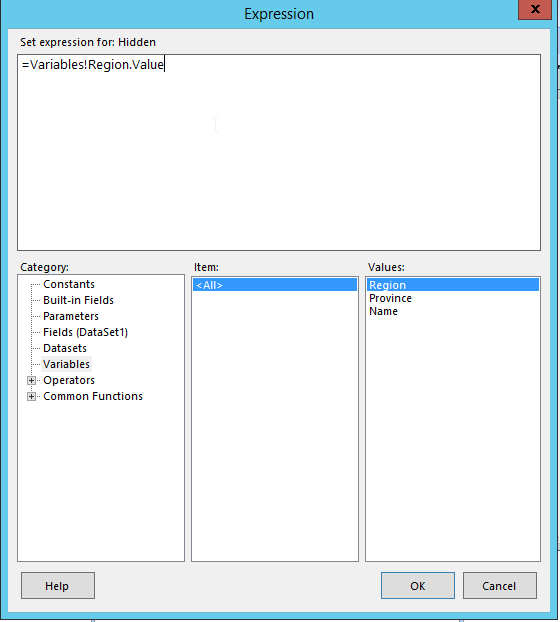
Show or Hide based on expression
Picture 8 – Show or Hide based on expression

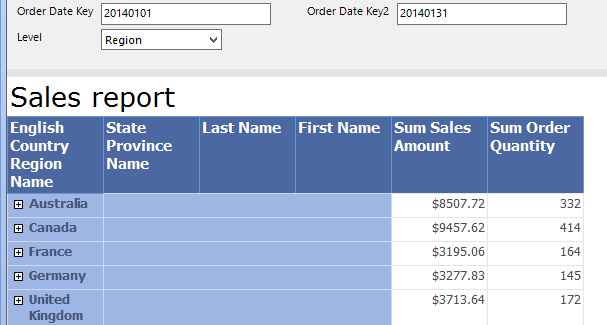
Let’s go to the Level parameter and choose the Region value. On the picture bellow you can see that all groups that are under the Region group in the hierarchy, are expanded. Now you can do the same steps for LastName group.

But there is one thing which should be resolved. Look at picture bellow at Expand/Collapse mark which is set to +. But the state of the group is expanded. Follow next steps to fix it.
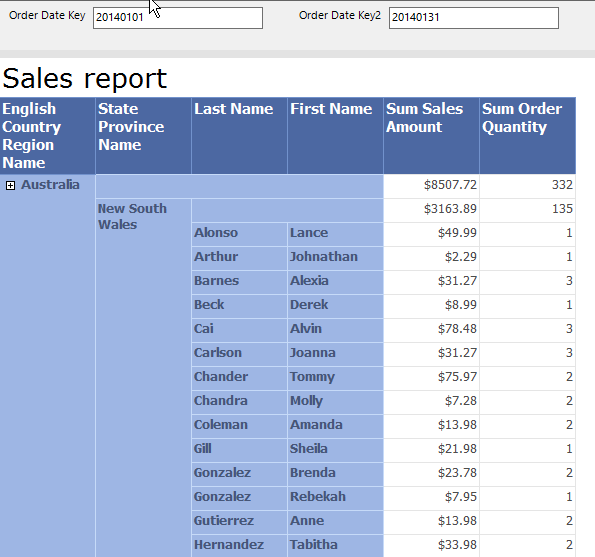
Sales Report
Picture 9 – Sales Report

On the picture bellow there is highlighted to which toggle items put bellow mentioned expressions in the Tablix. Each toggle item has its own InitialToggleState since it is standard report item.

Toggle Items in Report Tablix
Picture 10 – Toggle Items in Report Tablix

For the StateProvinceName group, there was set EnglishCountryRegionName Textbox as toggle item. (it was described in post Expand collapse groups) Click on EnglishCountryRegionName textbox, Go to Properties Pane, Visibility section and set to InitialToggleState expression =CBool(1+CInt(Variables!Region.Value)).
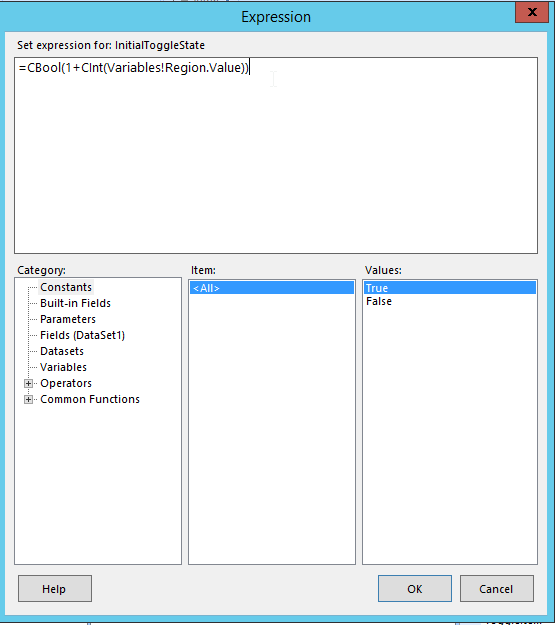
InitialToggleState, Expression
Picture 11 – InitialToggleState, Expression

After confirmation you should see the same in Properties Pane of EnglishCountryRegionName textbox, as on picture bellow.

InitialToggleState
Picture 12 – InitialToggleState

Now you should see fixed Expand/Collapse mark on picture bellow.
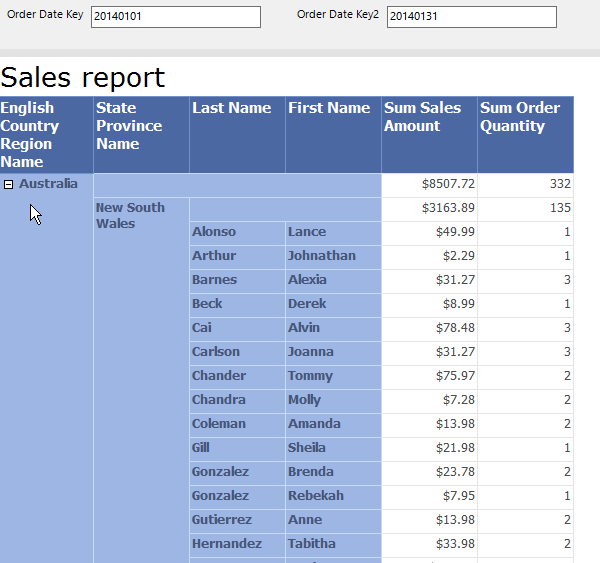
Sales Report, Expand
Picture 13 – Sales Report, Expand

Do the same steps for LastName group on StateProvinceName textbox with following expression =CBool(1+CInt(Variables!Province.Value)). On LastName textbox we do not need to set expression, since it is not toggle item of any groups.

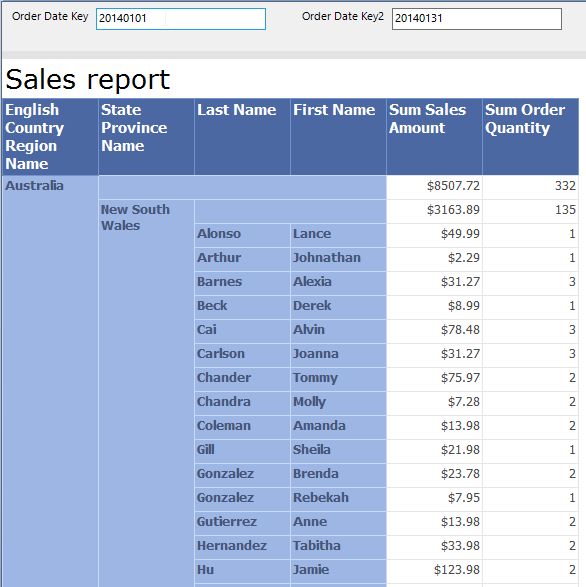
Let’s try report now, change Level parameter values. See pictures bellow how report layout changes.
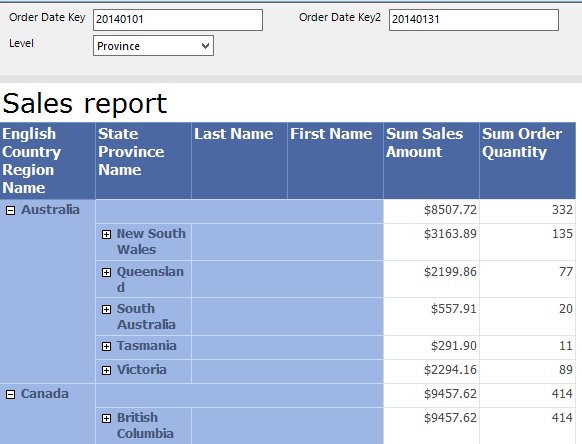
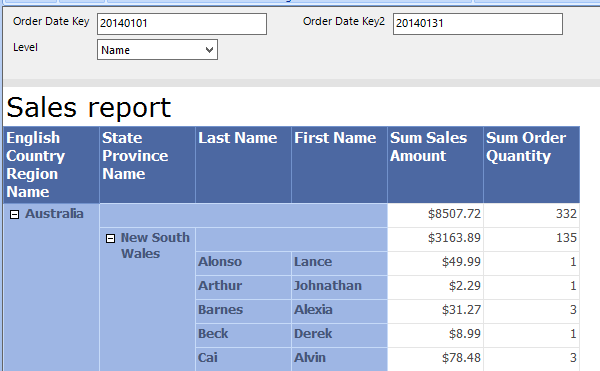
Sales Report
Picture 14 – Sales Report
Sales Report
Picture 15 – Sales Report
Sales Report
Picture 16 – Sales Report


Expand collapse groups

Expand, collapse functionality is nice feature of Reporting Services. In this post we use this functionality in connection with Tablix component. Be aware that more SSRS components support this functionality and it is good approach how to make reports and dashboards more user-friendly. It’s also a way how to make top to bottom analysis, since user can get data from totals to details by few clicks.

For practice you can use any of your report where you have Tablix or Matrix component with few groups. Or you go to one of my previous posts where you can download sample grouped report.

Lets have report or similar report as on picture bellow. So we have groups and detail data and our task is to prepare user view per Region Name by default with posibility to go to data on lower group level. In short we have to do 2 steps:

  1. Create toggle item in Tablix, which allow user to do Expand/Collapse action
  2. Hide groups at lower level of group hierarchy to see only Region Name when runing report by default

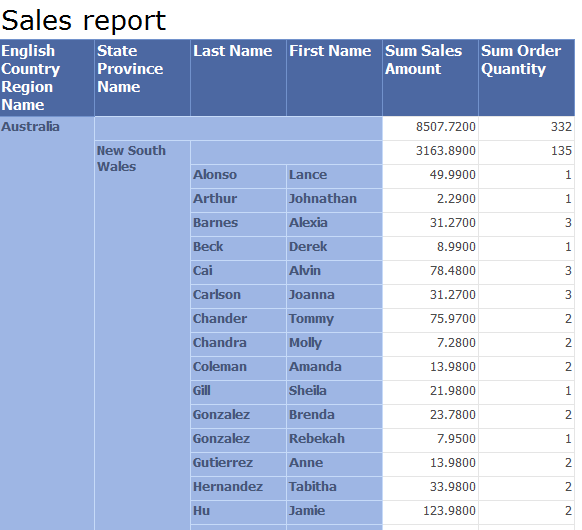
Lets have report or similar report as on picture bellow.

Sales report
Picture 1 Sales report

To set toggle item, click on group from which you would like to Expand/Collapse data. As you see on picture bellow, we would like to toggle EnglishCountryRegionName, so we have to go to StateProvinceName group property and there set toggle item. It is important that toggle item is textbox outside of the group we would like to Expand/Collapse (otherwise SSRS displays an error when rendering).

Tablix Toggle item
Picture 2 Tablix Toggle item

Right click on StateProvinceName group in Grouping pane and Properties from popup menu.

 Grouping Pane
Picture 3 Grouping Pane

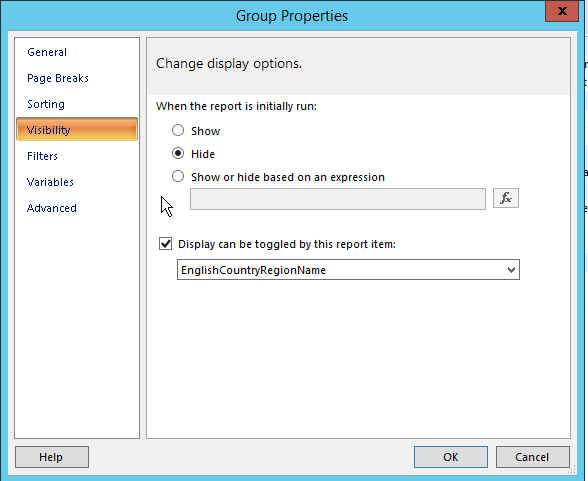
Go to Visibility tab in Group Properties dialog and here we check Display can be toggled by this report item.

Group Visibility
Picture 4 Group Visibility

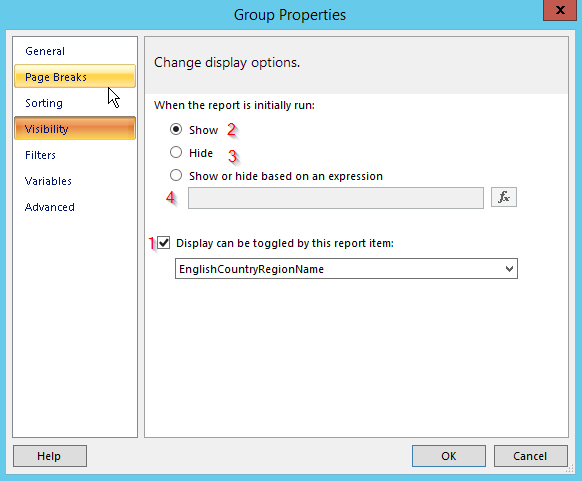
On picture bellow there are shown possible options you can set when managing Expand/Collapse functionality.

  1. For Expand/Collapse lets define toggle item. From select box lists EnlishCountryRegionName, it is text box we will use for Expand/Collapse functionality.
  2. Show – if we would like to have group expanded by default let’s leave it checked
  3. Hide – hides group by default.
  4. Show or hide based on an expression – I will explain in more detail in next posts.
Group Properties - Group visibility
Picture 5 Group Properties – Group visibility

For our scenario, Group Property dialog should look as on picture bellow. Check Hide, check Display can be toggled by this report item and select Report Item.

Group Properties
Picture 6 Group Properties

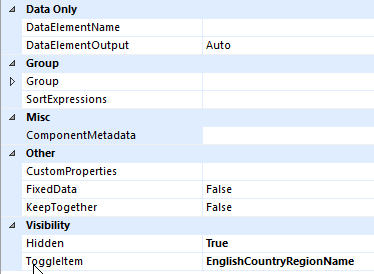
Group visibility and toggle item can be set also through Properties

Pane as shown on picture below. Click on Grouping Pane on StateProvinceName group. In Properties Pane set properties in Visibility section, Hidden and ToggleItem.

Properties Pane
Picture 7 Properties Pane

TIP: toggle item sign has “+” character by default. If you would like to change it go to your report item, which you set as toggle. In our case it is textbox EnglishCountryRegionName in the Tablix. In Properties

Pane you can change the default initial state sign trough InitialToggleState property.

Properties Pane Visibility
Picture 8 Properties Pane Visibility

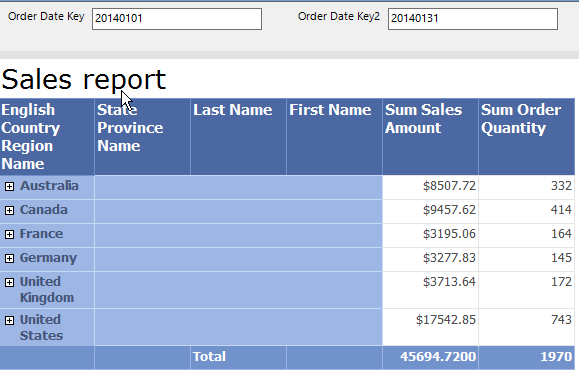
Finally, you should get your Tablix design looks like on the report bellow. Data are collapsed at Region name level. User can go the detail by expand toggle item situated on the left side of the report.

Sales report Collapsed
Picture 9 Sales report Collapsed

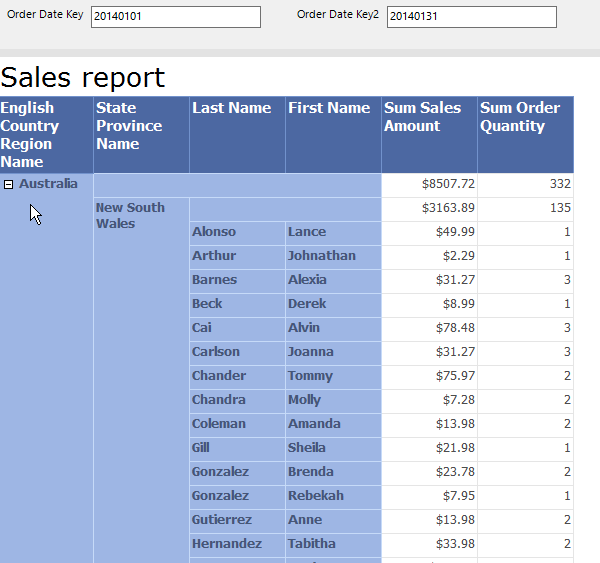
After clicking on Australia item you expand all data hidden under Australia region group.

Sales report Expanded
Picture 10 Sales report Expanded

In next post we extend our solution by parametrized Collapse/Expand group.

Grouping Tablix

I

In this post I will explain how to easily set grouping in report Tablix. We will extend our report from post Edit report with Report Builder.  If you would like to download the report go to the post page. We will add region name and province name groups to our report, so it will look like on picture bellow.

Short overview

  • Extend dataset – add new attributes grouping the data
  • Add parent group – English Country Region Name
  • Add child group – State province Name
Sales report
Picture 1 Sales report

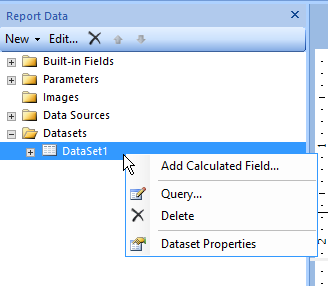
Let’s modify report dataset first. Go to Report data pane, under Datasets item right click on dataset you would like to modify and select Dataset Properties from popup menu.

Report data - Datasets
Picture 2 Report data – Datasets

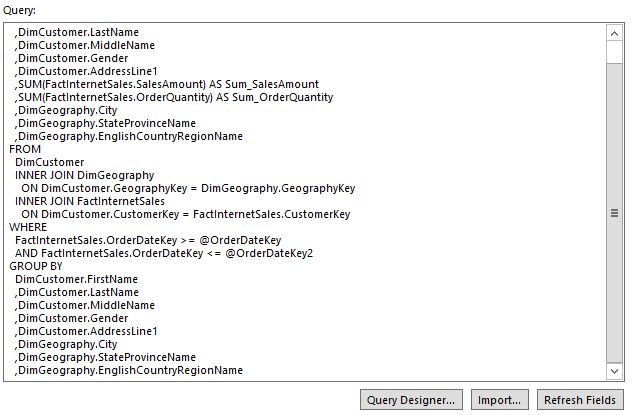
Add attributes from DimGeography dimension. City, StateProvinceName and EnglishCountryRegionName. You can edit query directly in Query text area or using Query Designer.

Query
Picture 3 Query

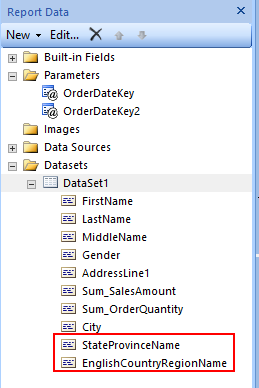
After editing query, by click on Refresh Fields button, we can check new attributes in report dataset.

Dataset
Picture 4 Dataset

There are two possibilities how to add new group to the report Tablix.

  1. Through Grouping Pane
  2. Directly in Tablix design

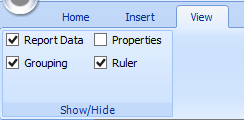
At first, we will add new group through Grouping Pane. Let’s check if we Group Pane is visible in design mode bellow. On the top of the menu click on View and check if Grouping checkbox is checked.

View menu
Picture 5 View menu

In Grouping Pane -> Row Groups you can see current report Tablix group. We will group our report by EnglishCountryRegoinName

attribute we added by extending our dataset. Right click on LastName group in Row Groups panel and Add Group from popup menu. Because we would like to group our detail data, we select Parent Group option.

Grouping Pane
Picture 6 Grouping Pane

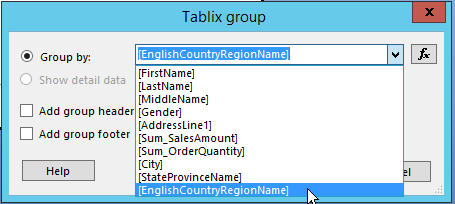
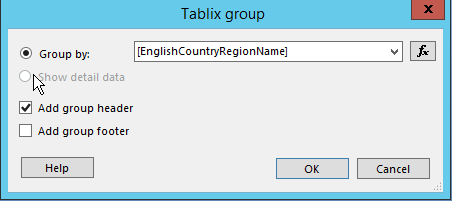
 New dialog box appears, we select EnglishCountryRegionName attribute. After Ok button, new column is added on the left side of the Tablix. Grouping direction is from left to->right, which means parent-> child relationship. That’s the reason why new column is added to the left.

Tablix group
Picture 7 Tablix group

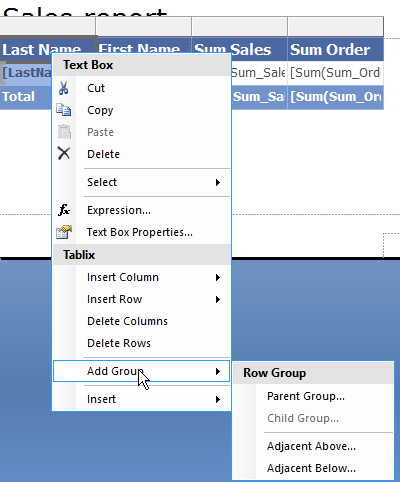
Picture bellow shows the second approach, adding group directly from Tablix area. Right click on textbox in Tablix -> Add Group -> Parent Group from popup menu.

Add group
Picture 8 Add group

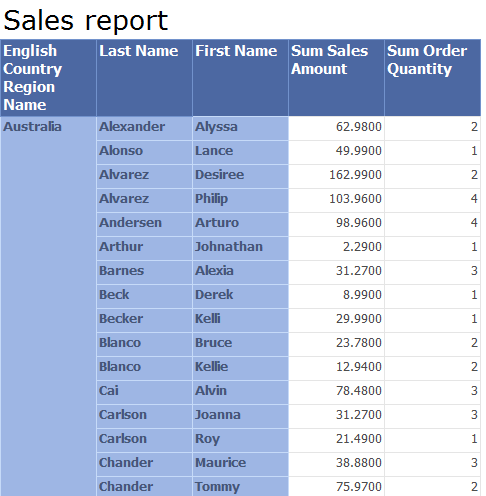
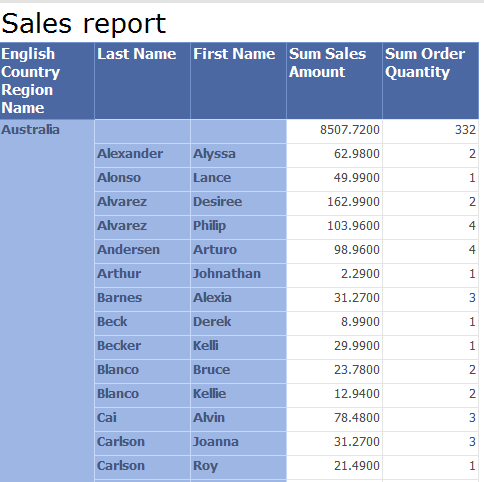
Let’s look at the report now. We can see that data are grouped by region name. But it would be useful to have running totals on the group level, to see how much Sales amount per region was profited.

Sales report
Picture 9 Sales report

When we return to step when we select grouping attribute, there is a possibility to add group header or group footer. In our case we would like to have totals above detail data, so we check Add group header. In case we would like to have data summarized below grouped data, we choose Add group footer.

Tablix group
Picture 10 Tablix group

Bellow we can see final report matrix design.

Sales report
Picture 11 Sales report

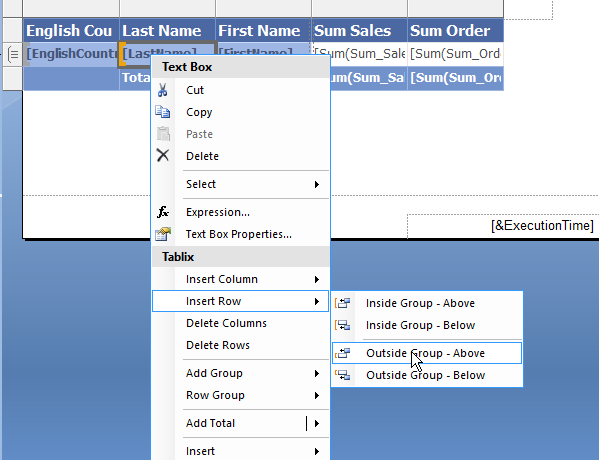
There is another approach how to add Group Totals. We can do it directly from Tablix area. Let’s go back when we have added new group by Group Totals is missing. Right click on Tablix Row -> Insert row from popup menu and select Outside Group – above (if we would like to have totals above grouped data). Before we invoke Popup menu, it is important to choose the inner group area we would like to summarize in Tablix. In our case it is detail group, Lastname group. We achieve it by clicking on Last Name column since it is column inside LastName group. In case we choose Inside Group option we would extend current group and add rows to detail data.

Tablix, Insert Row
Picture 12 Tablix, Insert Row

Look on picture bellow how the grouping looks from the design perspective.

Tablix
Picture 13 Tablix

Let’s add another group based on StateProvinceName attribute. We would like to place this new group between EnglishCountryRegionName group and Lastname group to create group hierarchy: region name -> province name -> data.

In Grouping Pane -> Row Groups, we can see our new parent group EnglishCountryRegionName. Reporting services set the group name based on attribute name by default. If we would like to change the name, we can manage it trough Group Properties.

Right click on EnglishCountryRegionName -> Add Group -> Child Group, do not forget to focus mouse cursor on parent group. Other option is to select LastName group and add new group as Parent Group.

Tablix
Picture 14 Add Group

On picture bellow we see Tablix with new group in design mode.

Tablix
Picture 15 Tablix

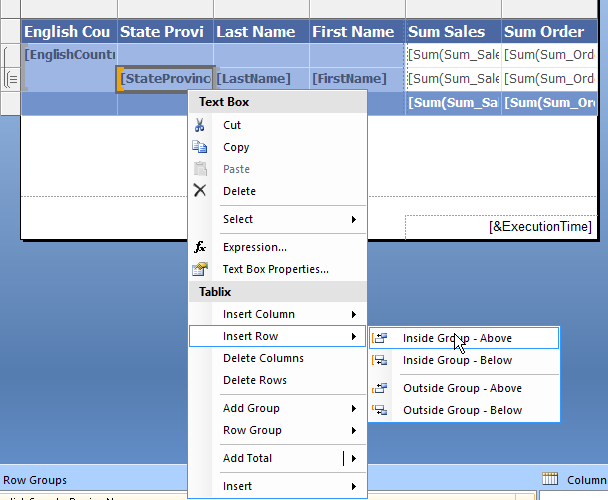
We would like to have subtotals in this group too, so let’s insert new row outside the group. Follow the same steps like with EnglishCountryRegionName group.

Tablix
Picture 16 Insert Row

.And that’s it. Picture bellow shows final group hierarchy in group panel.

Grouping Pane, Row Groups
Picture 17 Grouping Pane, Row Groups

Picture bellow shows report matrix in design mode.

Tablix, Grouping regions
Picture 18 Tablix, Grouping regions

Here is the final report matrix design with grouping.

Sales report, grouping
Picture 19 Sales report, grouping

If you follow steps in this post, you should have similar report. You can download it ReportSalesGrouping.