Reporting Services Report Tablix altering color

IAltering color in Report Tablix is common task for reporting developer. It helpes user to be better oriented in output data.

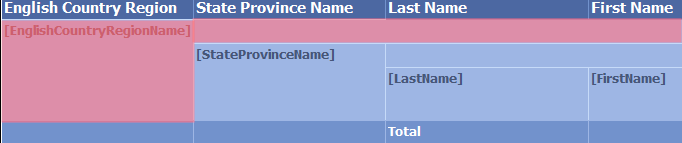
I will demonstrate this functionality on report created in one of previous post. I chose report with grouping. I will implement altering colour per row on each of Tablix group region. Lets start with EnglishCountryRegionName group region. Select Textboxes, highlighted on picture bellow.

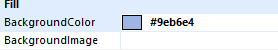
Go to Report Properties pane to Fill section. There is set static color as you see on the picture bellow.

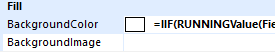
Replace the static colour with following expression.

=IIF(RUNNINGValue(Fields!EnglishCountryRegionName.Value,CountDistinct,"DataSet1") MOD 2 = 1, "#9eb6e4", "White")

I try to explain the expression in more detail. We use function RunningValue which takes tree arguments. The first one is the field value, we use EnglishCountryRegionName value returnign name of each country region. The second one parameter is aggregate function. In our case it is count distinct, which will be calculated for each EnglichCountryRegionName field. The last one parameter sets scope for which the function is used. In our case we can put Nothing or “DataSet1” as the scope.


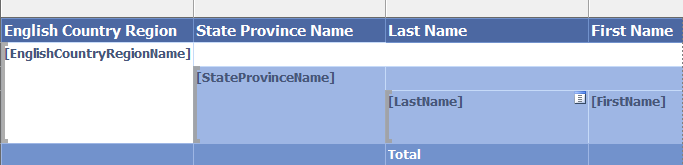
In design mode, there will not be visible any colour, Expression will be rendered when the report is running.

When running report, we can see that background colour changes for each EnglishCountryRegionName value.

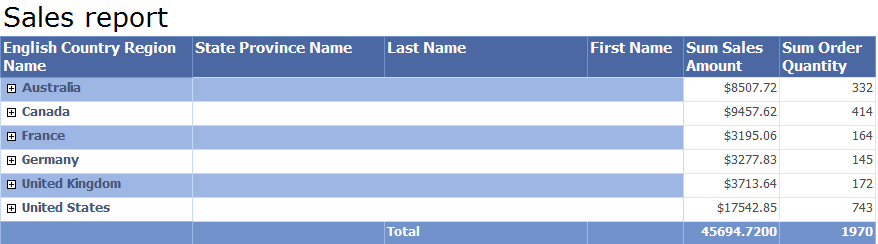
Repeat the same for other groups to achieve similar report design on picture bellow.


Splitting, merging cells in Tablix

To make your report Tablix looking better it could be very useful feature. As you can join Cells in excel you can join merge Textboxes in your Report Tablix.

  1. Select textboxes you would like to join
  2. Right click on your selection and Merge Cells in popup menu
Merge cells
Picture 1 Merge cells

Bellow you can see the result.

Sales report
Picture 2 Sales report

For the opposite action:

  1. Select merged Textboxes and select Split Cells from popup menu.
Split Cells
Picture 3 Split Cells


SSRS level function to format recursive Tablix group

II will extend report created in post and show you how you can implement formatting for recursive group with the Level function.

Open report from the mentioned post or use another one with recursive Tablix group. Choose any of an item in the Tablix. I chose the Path text box since it will be more illustrative. Click on the Textbox and go to Properties Pane to Padding section, Left, Expression and put following formula.

Level function
Picture 1 – Level function

You should see similar settings in Properties Pane as on the picture bellow.

Level function Properties Pane
Picture 2 – Level function Properties Pane

Look at the report on picture bellow. You can see that the Path Textbox has dynamic padding based on how many recursive child’s current item has. As states in short description, Level function Returns a zero-based integer representing the current depth level of a recursive hierarchy. It helps in our scenario to change format of Padding property based on which depth level of hierarchy is current item placed.

Recursive Tablix group with dynamic padding format
Picture 3 – Recursive Tablix group with dynamic padding format